Summer Dust Storms In Phoenix
310 likes | 579 Views
Summer Dust Storms In Phoenix. Updated Station Climatology and Pattern Classifications. Craig Shoemaker NWS WFO Tucson Jeffrey T. Davis NWS WFO Tucson. Objectives of Study. Update and Validate Dust Storm Events at Sky Harbor International Airport.

Summer Dust Storms In Phoenix
E N D
Presentation Transcript
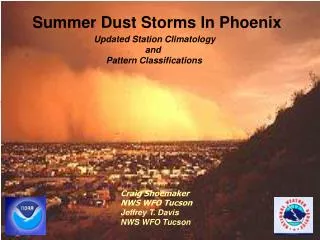
Summer Dust Storms In Phoenix Updated Station Climatology and Pattern Classifications Craig Shoemaker NWS WFO Tucson Jeffrey T. Davis NWS WFO Tucson
Objectives of Study • Update and Validate Dust Storm Events at Sky Harbor International Airport. Premise of Studies: Sky Harbor International Airport is centrally located enough with respect to the metropolitan area so that storms identified in the study can be assumed to be of major areal importance.
Objectives of Study • Classify Large-Scale Patterns Associated with Dust Storms Events. • Brazel and Nickling (1986) – “The Relationship of Weather Types to • Dust Storm Generation in Arizona (1965-1980).” Used large-scale • patterns to identify 4 dust storm generation weather types: Type 1 - Frontal Type 2 - Thunderstorm Type 3 - Tropical Disturbances Type 4 - Upper-level/cut off lows McCollum (1993) – “Large-scale Patterns Associated with Severe Summertime Thunderstorms over Central Arizona.” Identified 3 distinct patterns based on 31 cases from 1978-1990.
Objectives of Study • Classify Mesoscale Patterns Associated with Dust Storms Events. MacKeen (2001) – “Summertime Storm Initiation and Evolution in central Arizona.” Identified 3 storm repeat regimes.
Objectives of Study • Study the Annual Variability in Dust Storms for Possible Seasonal Predictors.
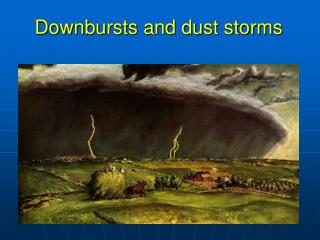
OverviewWhat do Summer Dust Storms look like? A Wall of Dust!
Study Methodology Data • Surface Data - Hourly Surface Observations for Phoenix Sky Harbor International Airport (PHX) for June through September 1948 to 2002. Climate Data from NCDC. • Upper-air Data – NCEP/NCAR reanalysis 12Z charts for identified Dust Storm days. Upper-air data from CDC. • Storm Data – Local Storm Data from 1959 to 2002. Storm Data from NCDC. Criteria • Visibility and Present Weather - Visibility reduced to ½ a mile or less with blowing dust reported (BLDU). • Wind – Directional shift and/or increase in speed accompanying or following the reduced visibility in blowing dust.
Objective 1: Updated Dust Storm EventsAverage Statistics 1948-2002 • Average Number of Dust Storms– 2.8 per year. Last 30 years- 1.6 per year. • Average Arrival Time – 6:33 PM MST • Average Wind Direction – Southeast (121 Degrees) • Average Max Wind Speed – 43 MPH • Average Visibility – ¼ of a mile Total Number of Cases: 161
Summer Dust Storms Frequency by Month Peak in Late July and Early August
Summer Dust Storms Frequency by Time Peak between 5 and 8 PM MST
Summer Dust StormsFrequency by Wind Direction Dominated by East to Southeast Approaches
Summer Dust Storms Frequency by Visibility 33% that hit the airport do not meet NWS warning criteria
Summer Dust Storms Frequency by Wind Speed Very few are accompanied by severe winds
Objective 2: Classified Large-Scale PatternsSevere Thunderstorm and Dust Storm Patterns • This study used 161 cases to identify 5 distinct Large-Scale Patterns Associated with Dust Storms. 8 cases could not be classified. • McCollum (1993) used 31 cases to identify 3 distinct Large-Scale Patterns Associated with Severe Thunderstorms. 4 cases could not be classified.
McCollum (1993) Severe Thunderstorm Pattern I • 9 cases out of 31 fit this pattern. • Broad High over Southern ½ US. • Deep Easterly Flow over TX, NM, AZ. Sources: http://www.wrh.noaa.gov/tucson/monsoon/severel.html http://www.cdc.noaa.gov/Composites/Day
Phoenix Dust Storm Pattern I • 40 cases out of 161 fit this pattern. • Broad High over US. • Deep Easterly Flow over TX, NM, AZ. Source: http://www.cdc.noaa.gov/Composites/Day/
McCollum (1993) Severe Thunderstorm Pattern II • 9 cases out of 31 fit this pattern. • High Amplitude Ridge over Wrn US. • Northeast to East Flow over AZ. • Occasional weak cold front will move • into AZ from the east with moisture • from the high plains. Sources: http://www.wrh.noaa.gov/tucson/monsoon/severel.html http://www.cdc.noaa.gov/Composites/Day/
Phoenix Dust Storm Pattern II a • 25 cases out of 161 fit this pattern. • High Amplitude Ridge over Wrn US. High • cell centered near Srn NV or Srn UT. • North to East flow over AZ. Source: http://www.cdc.noaa.gov/Composites/Day/
Phoenix Dust Storm Pattern II b • 38 cases out of 161 fit this pattern. • High Amplitude Ridge with High cell • centered near 4 corners area. • Deep Easterly Flow over NM & AZ. Source: http://www.cdc.noaa.gov/Composites/Day/
McCollum (1993) Severe Thunderstorm Pattern III • 9 cases out of 31 fit this pattern. • Broad High over Srn 1/3 of US. High cell • positioned West of AZ and near FL. • Easterly flow over Nwrn Mexico. Sources: http://www.wrh.noaa.gov/tucson/monsoon/severel.html http://www.cdc.noaa.gov/Composites/Day/
Phoenix Dust Storm PatternIII • 21 cases out of 161 fit this pattern. • Broad High over Southern US. Secondary • High cell usually centered West of AZ. • Deep Easterly Flow over Nrn Mexico. Source: http://www.cdc.noaa.gov/Composites/Day/
Phoenix Dust Storm PatternIV • 29 cases out of 161 fit this pattern. • Sharp Trough along the West coast. • Southwest to Southeast Flow over AZ. Source: http://www.cdc.noaa.gov/Composites/Day/
Objective 4: Study Annual VariabilityFuture Work Maricopa County population growth does not totally explain why some years experience no dust storms at PHX. Investigate the relationship between various parameters to dust storm frequency. • JFM and AMJ La Nina (cold) and El Nina (warm) episodes from NCEP/CPC. • Winter and Spring precipitation for AZ Climate Division 6. • Average Palmer Drought Severity Index for AZ Climate Division 6. • Satellite-derived vegetation Index.
SUMMARY • Updated Dust Storm Events (1948-2009) for PHX Sky Harbor International Airport. • Classified 5 distinct Large-Scale Pattern Associated with Dust Storm Events. • Study 16 Dust Storm Events for possible classification of repeated storm regimes. • Study various parameters for possible seasonal predictors of Summer Dust Storm frequency.
Any Questions and/or Comments?