Download

1 / 34
340 likes | 668 Views
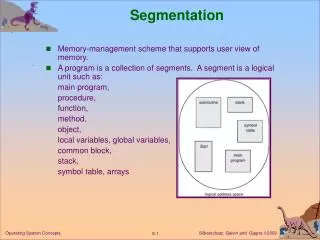
Segmentation Overview. Ken Homa. Attacking Markets. Market definition Segmentation Targeting Positioning. Segmentation Finishing the Job. Targeting selecting the segments with the highest company-specific potential Positioning

E N D
Segmentation Overview Ken Homa
Attacking Markets • Market definition • Segmentation • Targeting • Positioning
SegmentationFinishing the Job • Targeting • selecting the segments with the highest company-specific potential • Positioning • compiling a mix of marketing elements that precisely maps to the target market segment
Market Continuum Mass Market Custom / Individual
Mass Market PROs Highest apparent potential Scale economies Contained complexity CONs Majority fallacy Value excesses / shortfalls
Custom / Individual Markets PROs Preciselymatched to value functions Selectively applies competitiiveadvantages CONs Burdensome operating economics Uncertain logistical feasibility
Market Continuum Mass Market Segment / niche Custom / Individual
Hot TopicSegments of Size One • Direct relationship with customers • lifetime value • Mass customization of products • make to order • Individualized service offerings • ala carte menu
Market Segmentation • Focus limited resources • Map to customers’ value function • Create specific scale economies • Leverage competitive advantages • Create “mini-monopoly” “Sweet spot” between mass and custom markets
“Market Segment” Relatively homogeneous groups of buyers who differin their broad product requirements(fromothergroups)and exhibit a differentresponse to a particular marketing mix Targeting to increase operating efficiency or to create market inefficiency
Attractive Segments • Substantial / growing • Profit pool • Homogeneous • Intra-segment • Heterogeneous • Inter-segment • Actionable / accessible • Media reach, distribution • Winnable • Competitive advantage
Natural Old variable Alignment Old / modified game “Parachute” Induced New variable Creation New game “Magnet” Market Segments
Isolateanidentifiable highpotentialgroup Searchforcommon buyingbehavior Develop an efficient. targeted mktg. mix “Classic” Approach
Common Segmentation Bases Geographic Demographic Psychographic Behavioral Temporal (time)
Geographic Regional preferences Metro / rural Climate related Stage of PLC
Demographics Age (chronological, psychological) Gender, race, nationality Income, social strata Education, occupation Family size, life cycle
Psychographics Socialclass Upper, middle, lower Lifestyle Smokers : Defiant,casual, careful Personality Self-confident, impulsive, status-conscious Particularly relevant for communications strategy
“Classic” Approach Isolateanidentifiable highpotentialgroup Searchforcommon buyingbehavior Develop an efficient. targeted mktg. mix
Searchforcommon buyingbehavior Identify actionable characteristics Develop an efficient. targeted mktg. mix Behavioral Approach
Benefits Toothpaste : cosmetic, hygiene, economy Useoccasions Business, vacation, family travel Lifecycleevents Birth, graduation, retirement, death Userstatus Non-user, 1st timer, ex-user, regular Usagerate Heavy, average, light Loyalty Switcher, shifting, split, hard core Readinessstage Aware, informed, interested, intending Attitude Enthusiastic, positive, indifferent, negative, hostile Behavioral Segments
Heavy Users PRODUCT (% USERS) HEAVY HALF LIGHT HALF Soups and detergents (94%) 75% 25% 71% 29% Toilet tissue (95%) 79% 21% Shampoo (94%) 75% 25% Paper towels (90%) 83% 17% Cake mix (74%) 83% 17% Cola (67%) 87% 13% Beer (41%) 81% 19% Dog food (30%) 95% 5% Bourbon (20%)
Heavy Users • Top 50% typically > 75% of total sales • Heavy users (beer) = 7X light users • Often, the most demanding segment • Sometimes vulnerable to price appeals • But, surprisingly resistant to change
“Apparent Loyalty” Low price Habit Indifference High switching costs Availability Bottom line : Loyals may not really be loyal
Benefits Segmentation Link to Product Valuation Model What’s important ? What’s ideal ? Proximity to ideal ? Find groups with similar importance weights and ideal points Cluster analysis (related groups) Factor analysis (High correlations) Analytical endpoint : perceptual map
Product Positioning MapBreakfast Market Expensive Bacon and eggs Cold cereal Slow Quick Pancakes Hot cereal Instant breakfast Inexpensive
Highpriceperounce Brand C Lowin calories Highin calories Brand B Brand A Lowprice perounce Product Positioning MapInstant Breakfast Market
Market Map High Price E A G D C B Low Quality High Quality F Low Price
Perceptual Map High Price VALUE E A G D C B Low Quality High Quality F Low Price
Perceptual Map High Price E A G D C B Low Quality High Quality F Low Price
Perceptual Map High Priced 1.0 0.8 0.6 0.4 0.2 Fantasy Educational, animals Marineland Fun rides Knott’s Berry Farm Disneyland -1.6 -1.4 -1.2 -1.0 -0.8 -0.6 -0.4 -0.2 0.2 0.4 0.6 0.8 1.0 1.2 1.4 1.6 -0.2 -0.4 -0.6 -0.8 Magic Mountain Lion Country Safari Busch Gardens Economical
High Priced 1.0 0.8 0.6 0.4 0.2 Fantasy Educational, animals Marineland Fun rides Knott’s Berry Farm Disneyland -1.6 -1.4 -1.2 -1.0 -0.8 -0.6 -0.4 -0.2 0.2 0.4 0.6 0.8 1.0 1.2 1.4 1.6 -0.2 -0.4 -0.6 -0.8 Magic Mountain Lion Country Safari Busch Gardens Economical Perceptual Map Ideal Points 1 3 2
Takeaways Analytically driven, data intensive Infinite combinations & permutations Simplifying heuristics : perceptual maps Classic & behavioral approacheseventually meet “in the middle” Goal : creativity + actionable efficiency