Download
1 / 30
300 likes | 420 Views
National and global meteorological requirements for spectrum. Dr Sue Barrell Assistant Director (Observations and Engineering) Australian Bureau of Meteorology. Bureau of Meteorology.

E N D
National and global meteorological requirements for spectrum Dr Sue Barrell Assistant Director (Observations and Engineering) Australian Bureau of Meteorology
Bureau of Meteorology • The overall mission of the Bureau is to observe and understand Australian weather and climate and provide meteorological, hydrological and oceanographic services in support of Australia’s national needs and international obligations. • Mandate and authority derives from Meteorology Act 1955 • Funded through Government appropriation • Public good • The Bureau is an Executive Agency within the Environment and Heritage Portfolio
The role of the Bureau • Basic Objectives of the Bureau: • Climate record – meet the need for reliable climate data • Scientific understanding – advance the science of meteorology and develop an understanding of Australia’s weather and climate • Community welfare – contribute to: • reduction of the social and economic impact of natural disasters • safety of life and property • national security • economic development and prosperity of primary, secondary and tertiary industry • community health, recreation, and quality of life • International cooperation – advance Australia’s interests in and through international meteorology
The Bureau’s services to the community • Disaster mitigation (severe storms, tropical cyclones, fire weather, etc) • Water resource monitoring/prediction • Drought assessment • Climate monitoring • Forecasts • Public weather (for the media, and website) • Marine (incl Navy) weather, seas state, etc • Aviation and Defence weather
Spectrum usage by the Bureau of Meteorology • Observing Systems • Passive Systems • Active Systems • Downlink frequencies for dissemination of satellite data • Meteorological aids: about 900 radiosonde stations worldwide in the 400 MHz band • Ground-based systems observing in the high frequencies (IR, Visible, UV)
Smoke - large part. Shadow Grass Lake Fire Hot Area Cloud Soil Smoke - small part. Passive satellite systemsdetect radiation emitted by molecules in the earth & atmosphere AVIRIS Image
Cirrus Snow Low Clouds Passive satellite systemscombinations of bands are used for retrieving information from radiation emitted by the earth and atmosphere For example: snow, low-cloud, high-cloud discrimination using 4 separate frequencies in the microwave spectrum
T11< T6.7 (T6.7-T11) >0 Stratosphere H2O Vapor Tropopause Height Troposphere Temperature Passive satellite systemsused for deep convection analysis using microwave and IR frequencies Deep convection presents many hazards to aviation (e.g., turbulence, lightning, large hail, icing).
Spectrum usage by the Bureau of Meteorology • Observing Systems • Passive Systems • Active Systems • Weather radars & vertical wind profilers • Space-based sensors such as altimeters eg. JASON, QUIKSCAT • Downlink frequencies for dissemination of satellite data • Meteorological aids: about 900 radiosonde stations worldwide in the 400 MHz band • Ground-based systems observing in the high frequencies (IR, Visible, UV)
Active Systems - Weather radar Tropical Cyclone Monica 24 April 2006 (Cat. 5) Plan and vertical scans, clearly locating eye structure and rain bands C Band Radar, Gove
Spectrum usage by the Bureau of Meteorology • Observing Systems • Passive Systems • Active Systems • Downlink frequencies for dissemination of satellite data • In exchange we provide satellite-positioning services from the Bureau’s earth-stations • Meteorological aids: about 900 radiosonde stations worldwide in the 400 MHz band • Ground-based systems observing in the high frequencies (IR, Visible, UV)
Constellation of Meteorological Satellites FY-1D (CHINA) METOP-A (EUMETSAT) GOES-9 (USA) 200°W MTSAT-1R (JAPAN) 140°E FY-2B (CHINA) 123.5°E INSAT 2-B (INDIA) 111.5°E GOES-10 (USA) 135°W FY-2C (CHINA) 105°E GOES-11 (USA) 105°W INSAT 3-A (INDIA) 93.5°E FY-2A (CHINA) 86.5°E GOES-12 (USA) 75°W INSAT 3-C (INDIA) 74°E NOAA-12,14,15,16,17,18 (USA) METEOR-3M-N1 (RUSSIA) INSAT 2-E (INDIA) 83°E METEOSAT-8 (EUMETSAT) 3.4°W GOMS (RUSSIA) 76°E KALPANA-1 (INDIA) 74°E METEOSAT-9 (EUMETSAT) 0° METEOSAT-6 (EUMETSAT) 63°E INSAT 2-C (INDIA) 48°E METEOSAT-7 (EUMETSAT) 57.5°E
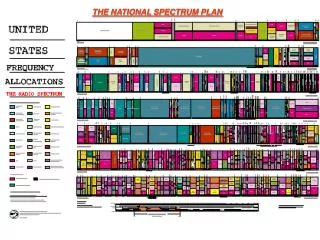
Active sensing Frequency bands Passive sensing GHz 94 - 238 Space – based • Cloud profiling GHz 100 – 853Space - based • atmospheric chemistry, water vapour, temperature GHz 13.25 - 36 Space - based • Wind, ice, geoid, vegetation, snow, rain, altimetry GHz 50 – 60Space - based • atmospheric oxygen for temperature profiling GHz 9.3 – 9.5 Surface - based • Weather Watch & Wind – find RADAR X - band GHz 36 – 37 Space - based •rain / snow precipitation • cloud liquid water / vapour • ocean wind & ice • soil moisture GHz 5.6 – 5.65 Surface - based • Weather Watch & Wind - find RADAR C - band GHz 5.15 – 5.46 Space - based • Geology • Sea – ice • Oceanography • Land – use • Interferometry GHz 31 – 32 Space - based • window channels related totemperature measurement GHz 2.7 – 2.9 Surface - based • Weather Watch & Wind - find RADAR S - band GHz 24 Space - based • atmospheric water vapour • cloud liquid water GHz 0.42 – 0.47 Space - based • Forestry monitoring ( biomass ) GHz 19 Space - based • sea-state and ocean ice •rain / snow • water vapour MHz 1680 Surface - based • Radiosonde ( balloon ) GHz 11 Space - based •rain / snow / ice • soil moisture • sea-state / ocean wind • ocean surface temperature MHz 1280 Surface - based • Wind Profiler ( Troposphere – Stratosphere ) MHz 400.15 – 403 Surface - based • Radiosonde ( balloon ) GHz 1.4 Space - based •vegetation index • soil moisture & salinity • sea-state / ocean wind • ocean surface temperature MHz 50 Surface - based • Wind Profiler ( Troposphere – Stratosphere ) Australian Bureau of Meteorology – 2006 spectrum use
Downlink frequencies Transmit and receive frequencies GHz 4.04 and 8 (X-band) future meteorological data dissemination services GHz 1.6955, 1.698, 1.7025, 1.7045, 1.707 • Polar-orbiting satellite NOAA (Davis) MHz 2064.5 • TARS (transmit) MHz 1695.5, 1698, 1702.5, 1704.5, 1707 • Polar-orbiting satellite (high resolution data) MHz 2032.2 • TARS (transmit) MHz 1691 • Geostationary satellite (low resolution data) MHz 1687.5 • Geostationary satellite FY2 MHz 1690 • TARS (receive) MHz 1687.1 • Geostationary satellite MTSAT-1R MHz 1684 • TARS (receive) MHz 137.35, 137.5, 137.62, 137.77 • Polar-orbiting satellite NOAA MHz 137.035 137.1, 137.795, 137.9125 • Polar-orbiting satellite FY1 MHz 2-20 • Marine HF (Voice and fax) Australian Bureau of Meteorology – 2006 spectrum use
HF Marine Broadcast System • Bureau of Meteorology Coastal Seas Forecast and High Seas Bulletin • Broadcast by voice and facsimile from two sites, Willuna and Charleville • Information to be broadcast is relayed by data link from Melbourne Head Office
Spectrum usage by the Bureau of Meteorology • Observing Systems • Passive Systems • Active Systems • Downlink frequencies for dissemination of satellite data • Meteorological aids: 38 radiosonde stations across Australia (and its territories) in the 400 MHz band (1680MHz in reserve) • Ground-based systems observing in the high frequencies (IR, Visible, UV)
Spectrum usage by the Bureau of Meteorology • Observing Systems • Passive Systems • Active Systems • Downlink frequencies for dissemination of satellite data • Meteorological aids: about 900 radiosonde stations worldwide in the 400 MHz band • Numerous and varied ground- and space-based systems observing in the high frequency bands (IR, Visible, UV) • Space-based systems dependent on radio frequency downlink for direct readout and timely data processing and assimilation
The Bureau’s services to the community Impact of satellite data on forecasts ECMWF experiment shows the impact of removing 3 AMSU-A instruments Another ECMWF experiment showed the impact of removing various observing systems from forecast analysis. Removing satellite data (purple line) has the largest impact on the forecast analysis.
Vegetation anomaly over Africa, MODIS/Terra Satellite Systems support Disaster Warning • Tropical cyclones • cloudimagery, rainfall rate, sea surface winds • Droughtand risk of wildfires • soil moisture, vegetation index • weather forecasting • TRMM, Meghatropiques (2009) and GPM constellation (2013) • Aqua, Terra • ERS-2, QuikScat, Metop/ASCAT • DMSP/SSMI • GOES, Meteosat, MTSAT • Weather forecasting in support of flood prediction • cloud imagery and rainfall rate • Spot, Landsat • all Operational met. satellites • Aqua –Terra • TRMM, Meghatropiques (2009) and GPM constellation (2013) • all Operational met. satellites • Aqua –Terra
Hot spots in Guinea, 2004, SEVIRI on Meteosat-8 • Tsunami • Ocean topography Floods in India, Terra, MODIS Esperanza Fires, Landsat Dust storm over Africa, 3 March 2004, Meteosat-8, SEVIRI Disaster Detection and Monitoring • Wildfires, volcanic eruptions • Visible and IR high resolution imagery • Dust storms • multispectral VIS/IR imagery • NOAA-Metop (AVHRR), Aqua-Terra (MODIS), SPOT, Landsat • MSG (SEVIRI),GOES , MTSAT • Oil spills • SAR Imagery Meteosat, MTSAT, GOES • Floods • Visible and IR high resolution imagery • NOAA-Metop (AVHRR), Aqua-Terra (MODIS, ASTER), SPOT, Landsat • MSG (SEVIRI),GOES, MTSAT • RadarSat, ENVISAT (ASAR)
The Bureau’s services to the community Sydney, Hunter and Northern Regions Hail Storm 3 December 2001 $30M estimated damages
The Bureau’s services to the community Tropical Cyclone Larry 20 March 2006 MTSAT-1R image of TC Larry • Satellite data was used to position the eye of the cyclone to an accuracy of 30km, 2 days before it made landfall • Weather radar data tracked the movement of the storm and was used to provide forecasts and warnings • Reached category 5 • No lives were lost • Total estimated damages: $360M Willis Island Radar TRMM (microwave) image of TC Larry
Solar Radiation Australian Water Availability Project • Partnership of Bureau of Rural Sciences, CSIRO, Bureau of Meteorology • Funded by National Heritage Trust, in support of the National Water Initiative • Establish monitoring and prediction of soil moisture and water balance components (rainfall, evaporation, transpiration, runoff) to: • Underpin sustainable & productive natural resource management and farm profitability • Support implementation of federal Exceptional Circumstances (drought relief) policy • Manage impact of drought on urban and rural water supplies • Real-time (in situ and space-based) data drives a water balance model: • Meteorological data • Precipitation, temperature, humidity, wind • Satellite-derived data • Solar radiation • Vegetation greenness • Land surface temperature Vegetation Greenness
Flexibility in the choice of frequencies used by the Bureau of Meteorology
Meteorological data – cost to the Bureau • Free international exchange of meteorological data • WMO Resolution 40: “.. provide on a free and unrestricted basis essential data and products which are necessary for the provision of services in support of the protection of life and property and the well-being of all nations, particularly those basic data and products, … required to describe and forecast accurately weather and climate, and support WMO Programmes; ..” • Extensive Australian use of foreign satellite data, freely provided in exchange for protection of satellite interests • Failure to cooperate puts access to this free data at risk
In the UK, the value to community today is 1.5 Billion pounds p/a Expect higher for Australia (UK 2x population, 2x GDP, 0.05x area of Australia) All data consistently point to the value of all Australian meteorological services being $2-3 Billion per annum Benefit to cost ratio of meteorological services: Value of meteorological services
Impact of compromised access to key spectrum bands • Disaster mitigation services affected • Quality of forecasts diminished – lives at risk • Increased costs resulting from weather-related disasters • Cost of all weather-related damage (severe wx, drought, flood, etc) in 2005: $276 billion. (UN expects a peak year of $1.3 Trillion USD before 2040.) • Australian GDP ~2% of global GDP, suggests peak Australian annual loss of as much as $30 Billion before 2040. • Assume 10% of damage is “avoidable”, then up to $3 Billion per annum value of meteorological services in Australia. • Foregone economic benefit of extended period forecasts
Summary • Bureau of Meteorology delivers high value services to the community Critical to the safety of life and the protection of property • Services depend on robust and effective observing systems and communications Largely dependent on unhindered access to radiofrequency spectrum A mix of frequencies and systems are essential to service continuity and quality • Timely & reliable access to satellite data essential to data assimilation Early detection and warning to maximise preparedness and response to severe weather and natural disasters • Future service improvements, such as extended period forecasts, depend on access to new satellite observations via X band reception