Download
1 / 7
70 likes | 86 Views
There have been recent interests on the relationship between the endocrine system and affective disorders.Existing evidence suggests that reproductive steroids such as estradiol affect virtually every system involved in the pathophysiology of depression, therefore, changes in reproductive steroids level during specific reproductive states may trigger depression in susceptible women.

E N D
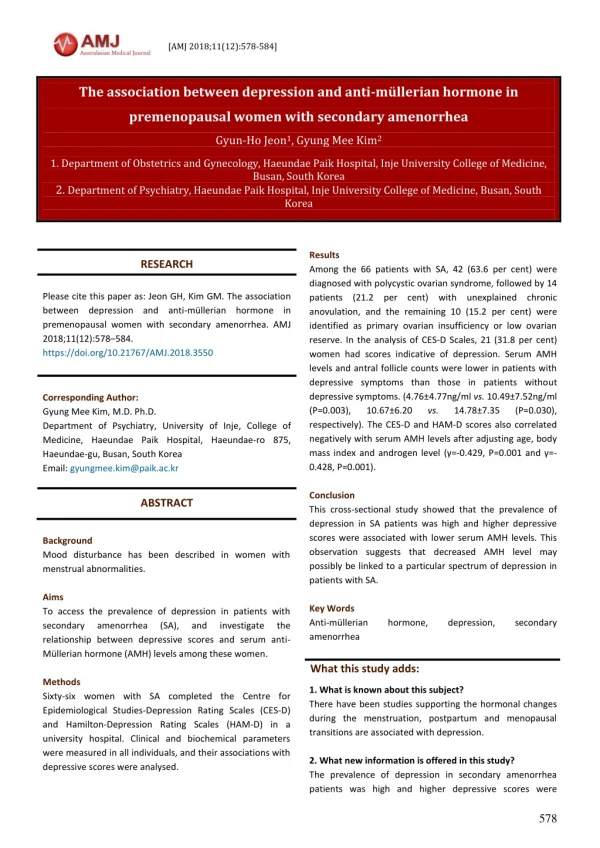
[AMJ 2018;11(12):578-584] The association between depression and anti-müllerian hormone in premenopausal women with secondary amenorrhea Gyun-Ho Jeon1, Gyung Mee Kim2 1. Department of Obstetrics and Gynecology, Haeundae Paik Hospital, Inje University College of Medicine, Busan, South Korea 2. Department of Psychiatry, Haeundae Paik Hospital, Inje University College of Medicine, Busan, South Korea Results Among the 66 patients with SA, 42 (63.6 per cent) were diagnosed with polycystic ovarian syndrome, followed by 14 patients (21.2 per cent) with unexplained chronic anovulation, and the remaining 10 (15.2 per cent) were identified as primary ovarian insufficiency or low ovarian reserve. In the analysis of CES-D Scales, 21 (31.8 per cent) women had scores indicative of depression. Serum AMH levels and antral follicle counts were lower in patients with depressive symptoms than those in patients without depressive symptoms. (4.76±4.77ng/ml vs. 10.49±7.52ng/ml (P=0.003), 10.67±6.20 vs. respectively). The CES-D and HAM-D scores also correlated negatively with serum AMH levels after adjusting age, body mass index and androgen level (γ=-0.429, P=0.001 and γ=- 0.428, P=0.001). Conclusion This cross-sectional study showed that the prevalence of depression in SA patients was high and higher depressive scores were associated with lower serum AMH levels. This observation suggests that decreased AMH level may possibly be linked to a particular spectrum of depression in patients with SA. Key Words Anti-müllerian hormone, amenorrhea RESEARCH Please cite this paper as: Jeon GH, Kim GM. The association between depression and anti-müllerian hormone in premenopausal women with secondary amenorrhea. AMJ 2018;11(12):578–584. https://doi.org/10.21767/AMJ.2018.3550 Corresponding Author: Gyung Mee Kim, M.D. Ph.D. Department of Psychiatry, University of Inje, College of Medicine, Haeundae Paik Hospital, Haeundae-ro 875, Haeundae-gu, Busan, South Korea Email: gyungmee.kim@paik.ac.kr 14.78±7.35 (P=0.030), ABSTRACT Background Mood disturbance has been described in women with menstrual abnormalities. Aims To access the prevalence of depression in patients with secondary amenorrhea (SA), relationship between depressive scores and serum anti- Müllerian hormone (AMH) levels among these women. Methods Sixty-six women with SA completed the Centre for Epidemiological Studies-Depression Rating Scales (CES-D) and Hamilton-Depression Rating Scales (HAM-D) in a university hospital. Clinical and biochemical parameters were measured in all individuals, and their associations with depressive scores were analysed. depression, secondary and investigate the What this study adds: 1. What is known about this subject? There have been studies supporting the hormonal changes during the menstruation, postpartum and menopausal transitions are associated with depression. 2. What new information is offered in this study? The prevalence of depression in secondary amenorrhea patients was high and higher depressive scores were 578
[AMJ 2018;11(12):578-584] associated with lower serum AMH levels. 3. What are the implications for research, policy, or practice? AMH levels in patients with secondary amenorrhea may be an important indicator for diagnosing or predicting depression in secondary amenorrhea patients. studied in menopausal women or premenopausal women with menstrual abnormalities,11,12 there are no study on the association between AMH levels and depression. This study was to examine the prevalence of depression in women with SA and investigate the relationship between serum AMH levels and depressive symptoms among these women. Method Subjects Study population comprised of patients evaluated by a single reproductive endocrinologist for symptoms of SA between March 1st 2017 and February 28th 2018. The subjects of this study were initially 78, but three refused to participate in the study and nine were excluded because of previous disease or medication. A total of sixty-six women aged 15-40 years who had no period for at least six months were enrolled in this study and they were divided into three groups. The first group consisted of 42 outpatients who were diagnosed with PCOS on the basis of Rotterdam criteria; the second group was formed of 14 patients with unexplained chronic anovulation (CA); the third group was made up of 10 patients with POI or low ovarian reserve. Women diagnosed with hyperprolactinemia, thyroid disorder, diabetes, Cushing’s syndrome, serious psychiatric disease such as bipolar disorders, schizophrenia, and schizoaffective disorder using the Diagnostic and Statistical Manual of Mental Disorders, fifth edition (DSM-5) were excluded and none had taken psychoactive medications or hormonal preparations for at least six months before this study, because these illnesses and medications may be primarily responsible for affective disturbances. All provided their written informed consent and the Institutional Review Board of Inje University Haeundae Paik Hospital approved the study protocol. Protocol All the subjects were studied to determine the cause of SA evaluating clinicolaboratory investigations and gynaecologic ultrasonography. Patients’ information including parity, menarche age and current medications were collected. The body mass index (BMI) was calculated at their first visit and blood samples were drawn after overnight fasting in the follicular phase. Serum FSH, luteinizing hormone (LH), estradiol, AMH, prolactin, insulin, thyroid-stimulating hormone (TSH), free thyroxin4 (fT4), total testosterone, free testosterone, dehydroepiandrosterone sulphate (DHEAS), 17-OH-progesterone, lipid profiles and glucose level were measured. In the gynaecologic ultrasonography, antral follicle counts (AFC) and ovarian volumes were measured in all individuals by one gynaecologist. In addition, all participants completed the Centre for Epidemiological Background There have been recent interests on the relationship between the endocrine system and affective disorders.1,2 Existing evidence suggests that reproductive steroids such as estradiol affect virtually every system involved in the pathophysiology of depression, therefore, changes in reproductive steroids level during specific reproductive states may trigger depression in susceptible women.3 Premenstrual dysphoric disorder, postpartum depression, and perimenopausal depression are well-known examples of the relevance of the reproductive steroids to depression.4-6 In particular, there have been numerous studies supporting the hormonal menopausal transition are associated with depression. Freeman et al.6 reported that a diagnosis of depression was 2.5 times more likely to occur in menopausal transition and these depressed women were 9.33 times more likely to have higher FSH levels than before the diagnosis of depression. The relationship between this reproductive steroid and depression has been reported not only in postmenopausal women but also in premenopausal women with secondary amenorrhea (SA) such as polycystic ovarian syndrome (PCOS) or primary ovarian insufficiency (POI). Rasgon et al.7 showed that high prevalence of depression among women with PCOS and suggested an association between depression and PCOS markers. Allshouse et al.8 reported depression was very common in women with POI, with some women clearly experiencing depression before their diagnosis of POI. Like this, it was suspected that depression was associated with amenorrhea condition not only in postmenopausal women but premenopausal women. Amenorrhea itself is symptomatically similar in these groups, but the pathophysiology and laboratory findings are clearly different. Anti-Müllerian hormone (AMH) which reflects ovarian reserve is one of the most important markers distinguishing the cause of amenorrhea and amenorrhea may be accompanied with abnormally high or low level of AMH such as PCOS and menopause.9,10 Although the relationship between various reproductive hormone including follicular stimulating hormone (FSH), testosterone, androstenedione and depression have been previously changes during 579
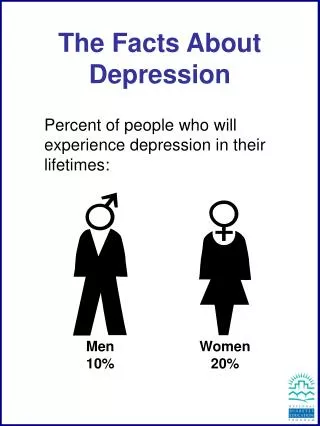
[AMJ 2018;11(12):578-584] Studies-Depression Rating Scales (CES-D) and a psychiatrist interviewed them to assess the severity of depressive symptoms using Hamilton-Depression Rating Scales (HAM- D). The CES-D results were scored using the cut-off score of ≥21. Statistical analysis The data are presented frequency with percentage for categorical variables and mean±standard deviation (SD) for continuous variables. The scores denoted depression was ≥21 in CES-D. Participants were divided into two groups: depressed group and non-depressed group. Clinical and biochemical variables were analysed using independent t-test and Mann-Whitney U test between two groups. Analysis of variance (ANOVA) with Duncan’s post-hoc test or Kruskal-Wallis test with Dunn’s post-hoc test was also employed as appropriate. To check if its distribution is normal, we used Shapiro-Wilk’s test. Partial correlation coefficients controlling for age, BMI and free testosterone were estimated to investigate the linear relationship between two continuous variables. For data visualization, scatter plots were also displayed. All statistical analyses were carried out using SPSS 24.0 (SPSS Statistics for Windows 24.0, Armonk, NY, IBM Corp) statistical software and p values less than 0.05 was considered as statistically significant. Results The clinical, hormonal and biochemical characteristics of subjects are reported in Table 1. Three groups showed no significant difference in the mean age, parity and menarche age, but BMI was significantly higher in the PCOS group than POI group. As shown in Table 1, they revealed typical hormonal profile which serum concentration of AMH, testosterone and free testosterone were higher in the PCOS group than those in CA and in POI group, while serum FSH level was higher in the POI group than the other groups. There were no significant differences of CES-D and HAM-D score among these groups. In the analysis of CES-D Scales, 21 (31.8 per cent) women who had CES-D scores ≥21 were considered depressed, while 45 (68.2 per cent) patients who had CES-D score <21 were regarded as non-depressed. When examined the prevalence of depression for each group of subjects, CA and POI group showed (7/14, 50 per cent) and (4/10, 40 per cent) respectively, while PCOS group revealed as 23.8 per cent (10/42). Clinical and biochemical comparison between depressed and non-depressed group were described in Table 2. The depressed group demonstrated lower mean AMH level and AFC in comparison to non-depressed group (4.76±4.77ng/ml vs. 10.49±7.52ng/ml (P=0.003), 10.67±6.20 vs. 14.78±7.35 (P=0.030), respectively). The CES-D and HAMD scores also correlated negatively with serum AMH levels after adjusting age, BMI and free testosterone level (γ=-0.429, P=0.001 and γ=-0.428, P=0.001, Figure 1). Discussion Although there have been accumulating data indicating that the transition to menopause and its hormonal change are associated with an increased risk of depression,6,12 there were few studies on SA and depression in premenopausal women. This study is one of rare report to examine the prevalence of depression among women with SA and the first research, to our knowledge, to investigate the relationship between depression and AMH among these patients. The first main findings of this study were increased prevalence of depression in women with SA. Although we cannot estimate the exact prevalence of depression in patients with SA from the small subjects of this study, the high prevalence of 31.8 per cent in our study may be considered meaningful, given that the prevalence rate of 1- month point for depressive disorder was estimated at 10.0 per cent.13 Although the prevalence of major depressive disorder in SA patients has not been previously reported, the prevalence of depression in PCOS patients, which account for the largest portion of SA, was also high (36.6 per cent) in the systemic review including 30 articles in 10 countries.14 The second main findings of this study were that patients in the depressed group demonstrated significantly lower serum AMH levels and AFC than in non-depressed group. Contrary to previous findings that elevated androgen was associated with depression,1,15 free testosterone was lower in the depressed group in our study. It can be speculated that the majority (32/45, 71.1 per cent) of non-depressed group in our study consisted of Korean PCOS patients who have the clinical and biochemical characteristics of low incidence of hyperandrogenism, metabolic dysfunction, obesity and insulin resistance compared with other ethnicities.16 This is also the cause of the findings that the BMI of patients with the PCOS in our study was not higher than in patients with CA, and the frequency of depression (23.8 per cent) in the PCOS group was thought to be rather lower than in other groups (50 per cent in CA group, 40 per cent in POI group). In the present study, depression was classified into depressive and non-depressive groups only by CES-D. However, HAM-D scores were positively correlated with CES-D scores, suggesting that depression was relatively 580
[AMJ 2018;11(12):578-584] accurate in this study. In addition, since the criteria for depression were cut-off with a CES-D score of 21, which is a moderate abnormal depression, it seems to be different from other studies in that it was applied more strictly in the diagnosis of depression compared to other studies. Finally, the negative correlation of serum AMH levels and AFC with the severity of depression was also demonstrated in this study. Although ovarian volume, which may have a subjective error in the evaluation of ovarian reserve, did not show a statistically significant relationship with depression, AFC was found to be inversely correlated with the severity of depression, which further supports the relationship between AMH, an objective measure of ovarian reserve, and depression. There have been previous studies supporting the reproductive steroids estradiol and progesterone regulate biological systems and depression.3,17 In particular, marked hormonal fluctuations in premenstrual phase, postpartum and menopausal transition period of female can exert a profound effect on brain regions associated with mood, memory, behavioural, cognitive response as well as reproduction.18 More specifically, sex hormones, mainly estradiol but also progesterone influence neuromodulation, and synaptic plasticity, furthermore other brain functions and virtually every neural pathway (serotonergic, dopaminergic, noradrenergic, cholinergic, GABAergic, etc.) responds to oestrogens. In addition, oestrogen receptor(ER)α and ERβ subtypes are located in brain regions such as cerebral cortex, hippocampus, and hypothalamus which were associated with cognitive function and emotion.19,20 Therefore, depression can occur in women vulnerable to hormonal fluctuation during the periods that oestrogen concentrations are low or progesterone concentrations depression in patients with SA is also thought to be derived from the effect of sex hormones on the behaviours and mood, because patients with SA have abnormally low oestrogen levels or show a non-cyclic pattern. In our study, there were no significant differences in estradiol and progesterone levels between depressed and non-depressed group. Therefore, oestrogen or progesterone levels alone may give us insufficient information for predicting mood state of patients with secondary amenorrhea. AMH produced by granulosa cell from preantral and small antral follicles, is a very important marker in that it not only provides crucial information in the cause of secondary amenorrhea for differential diagnosis, also has close relationship of oestrogen production.22 In the present study, the significantly lower AMH level in patients with depression may reflect the influence of AMH itself on mood, not regarding to oestrogen and other gonadotropin levels. Therefore, AMH levels in patients with secondary amenorrhea may be an important indicator for diagnosing or predicting depression in secondary amenorrhea patients. It can be presumed that AMH may directly affect the hypothalamic-pituitary-ovarian oestrogen and progesterone or indirectly influence on other factors related to mood control through the hypothalamic- pituitary-adrenal axis such as brain-derived neurotrophic factor, neurotransmitter-synthesizing neurotransmitter-metabolizing neurotransmitter receptors,23 but there is no exact evidence of relationship between them, yet. The limitations of this cross-sectional study are that heterogeneous groups included in secondary amenorrhea patients, PCOS patients with initially higher AMH levels and other groups with lower AMH levels were all analysed together. Other limitations of this study, small study population with different number of each group, possible selection bias from Korean PCOS patients who have different characteristics from other races included and lack of direct comparison with an age matched control group, should warrant caution interpreting our results. Also, this study was cross-sectional study, so we cannot interpret our results in terms of causality. Despite of these limitations, this study may suggest the high prevalence of depression in patients with SA and possible role of AMH levels as an important indicator for diagnosing or predicting depression in SA patients. Further prospective research should be needed to investigate the relationship between depression and decreased AMH levels in a larger population with matched control group using more rigorous evaluation of depression for more definite conclusions. Conclusion This cross-sectional study showed that higher prevalence of depression in SA patients and the association between higher depressive scores and lower serum AMH levels. This may suggest possible role of AMH levels as an important indicator for diagnosing or predicting depression in SA patients. Further research in a larger samples population with matched control group will be needed for more definite conclusion. dysfunction including enzymes, enzymes, and behaviours implicated in neurotransmission, high.21 are Similarly, References 1.Weber B, Lewicka S, Deuschle M, et al. Testosterone, androstenedione and concentrations are elevated in female patients with dihydrotestosterone 581
[AMJ 2018;11(12):578-584] major 2000;25:765–71. 2.Horacek J, Kuzmiakova M, Hoschl C, et al. The relationship between central serotonergic activity and insulin sensitivity in Psychoneuroendocrinology. 1999;24:785–97. 3.Schiller CE, Johnson SL, Abate AC, et al. Reproductive steroid regulation of mood and behavior. Compr Physiol. 2016;6:1135–60. 4.Schmidt PJ, Nieman LK, Danaceau MA, et al. Differential behavioral effects of gonadal steroids in women with and in those without premenstrual syndrome. N Engl J Med. 1998;338:209–16. 5.O’Hara MW, Schlechte JA, Lewis DA, et al. Controlled prospective study of postpartum mood disorders: Psychological, environmental, and hormonal variables. J Abnorm Psychol. 1991;100:63–73. 6.Freeman EW, Sammel MD, Lin H, et al. Associations of hormones and menopausal status with depressed mood in women with no history of depression. Arch Gen Psychiatry. 2006;63:375–82. 7.Rasgon NL, Rao RC, Hwang S, et al. Depression in women with polycystic ovary syndrome: clinical and biochemical correlates. J Affect Disord. 2003;74:299–304. 8.Allshouse AA, Semple AL, Santoro NF. Evidence for prolonged and unique amenorrhea-related symptoms in women with premature ovarian failure/primary ovarian insufficiency. Menopause. 2015;22:166–74. 9.Stracquadanio M, Ciotta L, Palumbo MA. Relationship between serum anti-Mullerian intrafollicular AMH levels in PCOS women. Gynecol Endocrinol. 2018;34:223–28. 10.Kruszyńska A, Słowińska-Srzednicka J. Anti-Müllerian hormone (AMH) as a good predictor of time of menopause. Prz Menopauzalny. 2017;16:47–50. 11.Klimczak D, Szlendak-Sauer K, Radowicki S, et al. Depression in relation to biochemical parameters and age in women with polycystic ovary syndrome. Eur J Obstet Gynecol Reprod Biol. 2015;184:43–7. 12.Freeman EW. Associations of depression with the transition to menopause. Menopause. 2010;17:823–7. 13.Judd LL, Akiskal HS, Paulus MP. The role and clinical significance of subsyndromal depressive symptoms (SSD) in unipolar major depressive disorder. J Affect Disord. 1997;45:5–17. 14.Cooney LG, Lee I, Sammel MD, et al. High prevalence of moderate and severe depressive and anxiety symptoms in polycystic ovary syndrome: a systematic review and meta-analysis. 2017;32:1075–91. 15.Dokras A, Stener-Victorin E, Yildiz BO, et al. Androgen Excess- Polycystic Ovary Syndrome Society: position depression. Psychoneuroendocrinology. statement on depression, anxiety, quality of life, and eating disorders in polycystic ovary syndrome. Fertil Steril. 2018;109:888–99. 16.Chae SJ, Kim JJ, Choi YM, et al. Clinical and biochemical characteristics of polycystic ovary syndrome in Korean women. Hum Reprod. 2008;23:1924–31. 17.Studd J, Nappi RE. Reproductive depression. Gynecol Endocrinol. 2012;28:42–5. 18.Wise PM, Dubal DB, Wilson ME, et al. Estrogens: trophic and protective factors in the adult brain. Front Neuroendocrinol. 2001;22:33–66. 19.Laflamme N, Nappi RE, Drolet G, et al. Expression and neuropeptidergic characterization of estrogen receptors (ERalpha and ERbeta) throughout the rat brain: anatomical evidence of distinct roles of each subtype. J Neurobiol. 1998;36:357–78. 20.Weiser MJ, Foradori CD, Handa RJ. Estrogen receptor beta in the brain: from form to function. Brain Res Rev 2008;57:309–20. 21.Studd J, Panay N. Hormones and depression in women. Climacteric 2004;7:338–46. 22.La Marca A, Pati M, Orvieto R, et al. Serum anti- müllerian hormone levels in women with secondary amenorrhea. Fertil Steril. 2006;85:1547–9. 23.Streiter S, Fisch B, Sabbah B,et al. The importance of neuronal growth factors in the ovary. Mol Hum Reprod. 2016;22:3–17. PEER REVIEW Not commissioned. Externally peer reviewed. CONFLICTS OF INTEREST The authors declare that they have no competing interests. FUNDING This study was supported by “the 2016 Inje University research grant” and “Inje University Haeundae Paik Hospital”. ETHICS COMMITTEE APPROVAL The Institutional Review Board of Inje University Haeundae Paik Hospital, 2017-01-018 healthy volunteers. hormone and 582
[AMJ 2018;11(12):578-584] Table 1:Clinical, hormonal and biochemical characteristics of women with secondary amenorrhea Chronic anovulation POI1 PCOS2 post-hoc test3 Variable Overall (n=10) (n=14) (n=42) Age (years) 26.11±8.05 29.60±10.85 26.79±9.07 25.05±6.81 Parity 0.24±0.56 0.30±0.48 0.36±0.74 0.19±0.51 Menarche age (years) BMI (kg/m2) 13.45±1.20 13.45±1.46 13.43±1.52 13.46±1.04 22.75±4.75 19.61±3.73 23.47±4.93 23.26±4.70 PCOS > POI PCOS > POI =Chr anovul AMH (ng/ml) 8.76±7.27 0.66±0.46 4.77±3.30 12.28±6.83 PCOS > Chr anovul LH (U/L) 16.68±16.88 22.28±23.18 14.82±29.98 16.05±7.85 POI > PCOS =Chr anovul FSH (U/L) 7.83±8.57 18.44±18.52 6.30±4.28 5.82±1.71 Estradiol (pg/ml) 73.63±79.60 234.94±124.35 172.61±67.66 167.78±99.46 269.80±129.01 -4 71.55±77.43 80.23±99.17 71.84±74.52 DHEAS (µmol/L) PCOS > POI =Chr anovul Testosterone (ng/ml) 0.42±0.29 0.22±0.14 0.21±0.09 0.54±0.29 Free testosterone (pg/ml) PCOS > POI =Chr anovul 1.97±0.81 1.50±0.70 1.38±0.62 2.28±0.73 Prolactin (ng/ml) 17.74±14.18 17.27±13.16 14.23±7.66 19.02±16.01 -4 TSH (µIU/ml) 2.15±1.20 3.21±1.67 2.08±1.40 1.90±0.81 fT4 (ng/dl) 1.25±0.20 1.12±0.19 1.28±0.24 1.27±0.17 T-Chol (mg/dl) 190.43±35.84 195.20±40.18 179.29±30.70 193.07±36.45 HDL (mg/dl) 58.96±17.04 65.60±22.47 58.86±25.27 58.03±14.60 LDL (mg/dl) 110.02±32.24 113.60±31.12 94.38±20.56 113.09±34.16 Triglyceride (mg/dl) 107.49±75.07 88.20±57.62 93.86±99.63 112.97±73.20 Glucose (mg/dl) 1 POI: primary ovarian insufficiency 2 PCOS: polycystic ovarian syndrome 3 Dunn’s or Turkey’s post-hoc test when p values of each variable <0.05. Shapiro-Wilk’s test was employed for test of normality assumption. 4 No significant difference at Dunn’s post-hoc test Table 2:Clinical and biochemical comparison between depressed and non-depressed group Depressed group (CES-D ≥21, n=21) 95.25±23.92 91.70±6.22 91.62±11.97 97.27±28.94 Non-depressed group (CES-D <21, n=45) Variable P value 0.8362 0.9352 0.0822 0.4271 0.0001 0.0002 0.0032 0.1652 0.5172 Age(years) Parity Menarche age (years) BMI (kg/m2) CES-D HAM-D AMH (ng/ml) LH (U/L) FSH (U/L) 26.43±8.70 0.24±0.54 13.02±0.75 23.44±5.58 31.48±7.86 12.05±6.18 4.76±4.77 16.67±25.25 8.99±12.58 25.96±7.82 0.24±0.57 13.66±1.32 22.43±4.34 10.40±5.09 3.76±2.74 10.49±7.52 16.68±12.13 7.30±5.97 583
[AMJ 2018;11(12):578-584] 0.9832 0.7682 0.1582 0.0431 0.8802 0.7182 0.5552 0.4281 0.0762 0.6242 0.9702 0.5522 0.0301 0.2451 Estradiol (pg/ml) DHEAS (µmol/L) Testosterone (ng/ml) Free_testosterone (pg/ml) Prolactin (ng/ml) TSH (µIU/ml) fT4 (ng/dl) T-Chol (mg/dl) HDL (mg/dl) LDL (mg/dl) TG (mg/dl) Glucose (mg/dl) AFC (antral follicle counts) Ovarian vol. (cm3) 1 P values were derived from independent t-test. 2 P values were derived from Mann-Whitney U test. Shapiro-Wilk’s test was employed for test of normality assumption. Figure 1: Correlation of serum AMH concentrations with CES-D and HAM-D scales 71.08±77.79 216.15±108.86 0.35±0.23 1.68±0.68 21.39±20.77 2.31±1.20 1.25±0.20 185.29±30.44 50.18±15.43 108.55±30.39 111.73±85.35 92.10±7.25 10.67±6.20 11.26±4.68 74.87±81.35 243.69±131.22 0.45±0.30 2.11±0.83 16.03±9.57 2.07±1.20 1.24±0.20 192.89±38.23 61.64±16.79 110.46±33.17 106.19±72.93 96.68±28.43 14.78±7.35 12.87±5.40 584