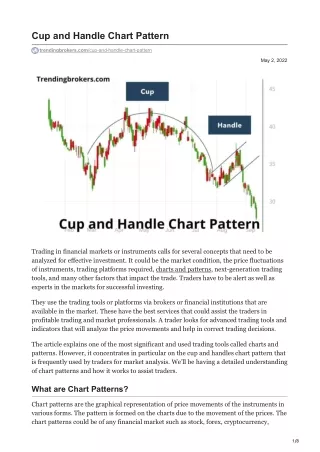
Cup and Handle Chart Pattern
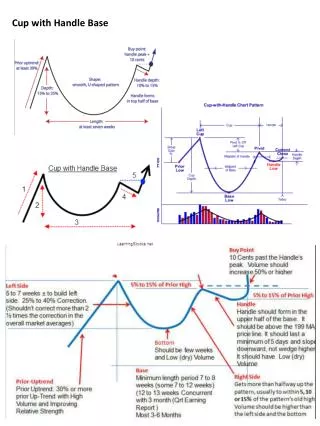
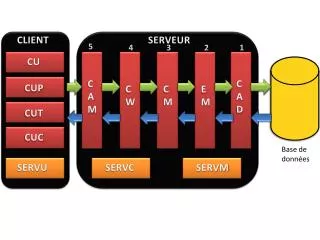
The article mainly focuses on the cup and handle chart pattern of the traditional chart patterns category. It is a highly popular chart pattern indicating the price movements on graphs. We all are familiar with the shape of a cup and its handle; the chart pattern weu2019ll be discussing is similar to that, thus getting its name from the shape of a cup. <br><br>It stimulates a U-shaped cup and a handle that signifies the breakout in the market. It is mostly found that the cup and handle indicate a bullish signal in the market and display an upward trend with various market opportunities to trade.

Cup and Handle Chart Pattern
E N D
Presentation Transcript
Cup and Handle Chart Pattern trendingbrokers.com/cup-and-handle-chart-pattern May 2, 2022 Trading in financial markets or instruments calls for several concepts that need to be analyzed for effective investment. It could be the market condition, the price fluctuations of instruments, trading platforms required, charts and patterns, next-generation trading tools, and many other factors that impact the trade. Traders have to be alert as well as experts in the markets for successful investing. They use the trading tools or platforms via brokers or financial institutions that are available in the market. These have the best services that could assist the traders in profitable trading and market professionals. A trader looks for advanced trading tools and indicators that will analyze the price movements and help in correct trading decisions. The article explains one of the most significant and used trading tools called charts and patterns. However, it concentrates in particular on the cup and handles chart pattern that is frequently used by traders for market analysis. We’ll be having a detailed understanding of chart patterns and how it works to assist traders. What are Chart Patterns? Chart patterns are the graphical representation of price movements of the instruments in various forms. The pattern is formed on the charts due to the movement of the prices. The chart patterns could be of any financial market such as stock, forex, cryptocurrency, 1/8
commodities, indices, metals, etc. The chart patterns play an important role in trading for technical analysis and are mostly used by stock and commodity traders. The data of price fluctuations are plotted on the graph that forms a pattern that occurs naturally. The patterns could be repetitive in certain situations, and therefore traders rely on these for trading in the markets. Charts have different kinds of patterns that are formed because of market conditions and factors changing the price of the instruments. These patterns could be reversal or continuation signals in the market; traders analyse them properly for favourable investments. (Read our Blog- Find Support and Resistance in chart patterns) Types of Chart Patterns Chart patterns are of three types that are used by the analysts of the market. The three main patterns are discussed below to help traders understand them and their use in the financial markets. So, let’s quickly drive in to enhance knowledge: Traditional Chart Pattern The traditional chart patterns are the common and most used patterns of the market. These have been introduced in the market for over decades and are still preferred by traders to make correct trading decisions. Traders can rely on these patterns and use them by checking the history for their use and how they could benefit the traders. 2/8
Below is the list of reversal and continuation traditional chart patterns: Reversal Chart Patterns: Head and shoulders Triple bottom reversal Double bottom reversal Double top reversal Triple top reversal Key reversal bar Continuation Chart Patterns: Flag and Pennant Channel Triangle Cup and Handle Harmonic Chart Pattern Harmonic chart patterns use the specific structures having distinct and consecutive Fibonacci ratio alignments that validate the harmonic patterns. The patterns calculate the Fibonacci of the price structures and identify the probable reversals of the market. The pattern assumes that the cycles or patterns formed are continuous. With these patterns, traders can enter and exit the market and have profitable investments. Here, we have the list of harmonic patterns that are used in the market: Butterfly Cypher Shark Crab Bat Deep crab 3 drives AB=CD 5-0 Gartley Candlestick Chart Pattern Candlestick is a well-known market chart pattern that is used by traders for favorable trades. It is a technical analysis chart pattern forming in the shape of a candle with a stick on the chart. These graphically represent the price movements of the market and help in predicting the market change. 3/8
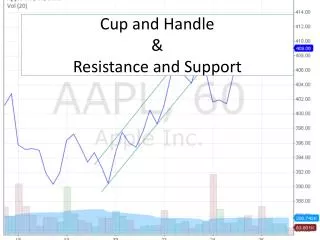
The Candlestick pattern was introduced by Steve Nison, and since then, it has been widely used in the world. It has various candlestick patterns that traders can use to analyse the market. Some of the candlestick patterns are: Inverse hammer Shooting star Three white soldiers Morning star Hammer Bullish engulfing Hanging man Three black crows The article mainly focuses on the cup and handle chart pattern of the traditional chart patterns category. It is a highly popular chart pattern indicating the price movements on graphs. We all are familiar with the shape of a cup and its handle; the chart pattern we’ll be discussing is similar to that, thus getting its name from the shape of a cup. It stimulates a U-shaped cup and a handle that signifies the breakout in the market. It is mostly found that the cup and handle indicate a bullish signal in the market and display an upward trend with various market opportunities to trade. The chart pattern of a cup and handle manifests the movement of the price of an instrument in a certain direction forming the shape of a cup and handle. On the graph, traders can clearly identify the pattern. It is a technical market indicator for price change. The formation of the cup and handle on the chart is like a bowl in a U shape, and the handle forms near that slightly downward and then move upwards. The right-hand side of the pattern indicates that there is less trade volume in the market. However, traders need to monitor the market to check the formations as it may take seven weeks to sixty-five weeks to form. The cup and handle chart pattern was established by William O’Neil in 1988 through his book named “How to make money in Stocks.” Analyzing the Cup and Handle Pattern The cup and handle are the chart patterns that occur on the graphs or charts to indicate the market situation. The patterns could be for short-term trades such as a minute or an hour or for long-term trading like for days, weeks, or months. Therefore, traders investing in both types of investments can use it to trade. The handle of the cup is a sign of stabilization in the market after a downfall in price. Cup is in U shape, after which the formation of the handle takes place; the cup shape is formed by the moving downward and then upwards to stabilize the trade as it moves back to the same magnitude. 4/8
In the handle, the price of the instrument moves sideways, taking the shape of a handle attached to U shaped cup. Although, traders should check the shape and market first as the handle could be triangle-shaped as well. The pattern of the cup and handle should have the handle smaller than the cup. It should not drop below the bottom half of the cup, thus, in the upper third of the cup. To have a better understanding of the pattern, let’s take an example. Suppose the cup shape is formed between $98 and $100, so in this condition, the handle should be near $100 and $99. If the handle formed is too deep, then traders should avoid it as the profitability chances are reduced in such situations. Moreover, the cup and handle also signal reversal and continuation in the markets. Traders can know this by the pattern formed when the price of an instrument is downward; in the long run, forming a cup with a handle to reverse the market trend and the prices of instruments begin rising. While the continuation pattern is formed in an uptrend of the market. The price of the instruments rises, forming the shape of the cup and handle, and then continues to rise. Using these signs, traders can know which pattern is formed and what should be done to make most of their investment. What Cup and Handle Indicate? Cup and handle are considered the bullish market patterns that signal the buying opportunities of the market. The formation of the pattern shows a downtrend which could be from days to weeks depending on the market conditions. The prices rise of the instrument in the market due to sell pressure created in the market. 5/8
The trader using the pattern should be careful and decide, keeping in mind other market factors. The financial markets are volatile, thus, bringing with them the risks of failure. To manage these traders, use the chart patterns that help them predict the market changes. To use the cup and handle appropriately, traders can watch out for the following: Length of the pattern The length of the cup and handle pattern is important as it helps in identifying it on charts and having the right trading decisions. The cups formed are usually long, forming U shape bottom that shows a strong market signal. Traders should avoid the cups that have sharp V bottoms as these are not the cup pattern traders should be looking for. Depth of the pattern The depth and length both are necessary to identify the pattern. The cup should not be too deep, and handles that are too deep should also be avoided. The handle should be in the upper half of the cup. Volume The volume of trade is also important as this gives an idea about market trading. When the price of an instrument declines, the volume of trade also decreases, remaining below the average of the bottom of the cup. There is a real increase in the volume of trade on breakout when above the handle resistance. 6/8
Duration The cup formed can extend from one to six months and even longer than that on the weekly charts. However, the handle formed is for one week to some weeks, generally completed between one to four weeks. The target of the pattern The target of the pattern is to estimate by measuring the distance between the right peak of the cup and the bottom of the cup. Trend In the continuation pattern, there should be a prior pattern that has existed for some time. It could be a few months old and not mature as when the trend is mature; there are fewer chances of continuation of the pattern. In addition, it has less upside potential to benefit the trader. Traders should be able to capture the essence of the pattern to make a profitable investment. They can study the charts and patterns formed, make their analysis, do research about how it works to have informed decisions and be the experts of the market. Limitations of Cup and Handle Chart Pattern Cup and handle are technical indicators, and like all the other tools, these all possess certain limitations. The pattern should be used in line with other technical indicators before any decision is made. As these could lead to profit or loss, one never knows. To begin with, the first limitation of the cup and handle pattern is that it takes time to form. Thus, delayed decisions. It can have a month to a year of time frames to form, and it could be in a week. So, makes it difficult for traders to identify and use in some cases. Another limitation of the cup and handle pattern is that the cup formed could be shallow and indicate a signal. Whereas the cup, when deep, can produce a false signal. It becomes difficult to analyze as the formations take time and could be incomplete sometimes. Conclusion The cup and handle is a unique chart pattern with characteristics to help traders trade in the financial markets. They can identify the pattern easily and trade in the market to make money. Readers with the article can understand the pattern and its features to analyze it and identify it on the charts quickly. However, this requires practice before jumping in. Traders can form their trading accounts with reliable brokers such as PrimeFin, which is a regulated and licensed broker having advanced tools and services for profitable trading. 7/8
Traders can use the services and apply the cup and handle chart patterns to trade and make money. 8/8