Introduction to Statistics and Statistics formulas
110 likes | 113 Views
Statistics formulation is the arithmetic department, this is liable for facts processing. The statistical approach is the observation of massive portions of facts and their properties. Often agencies use mathematical tactics to degree personnel or employeeu2019s collaborative property. We may also cope with one-of-a-kind mathematical formulation in this post. Here is a short introduction to information and their types.<br><br>This maintains your challenge and reviews stable, so that it will now no longer praise you similarly; however, it will even extend. It ensures continuity in planning, permitting yo

Introduction to Statistics and Statistics formulas
E N D
Presentation Transcript
Introduction to Statistics and Statistics formulas www.cheggindia.com
INTRODUCTION Statistics formulas are the mathematics division that is responsible for data processing. The statistical method is the study of large quantities of data and its properties. Often companies use mathematical approaches to measure employees or employee’s collaborative property. We may address different mathematical formulas in this post. Here is a brief introduction to statistics and their types.
TWO TYPES: DESCRIPTIVE AND INFERENTIAL Introduction to statistics starts with the two major statistical branches: Inferential and descriptive. Illustrative statistics are mainly to offer more detail on a series of facts. Inferential figures are to approximate or equate a more expansive group (a population). It uses data obtained on a limited population percentage. Inferential statistics thus require generalising over and over results, which descriptive statistics do not.
PROPORTION Some variables are categorical, which group or category belongs to a person. For example, a categorical variable is the “relationship status” and a person may be single, dating, married, divorced, etc. In any given group, the total number of people is called the frequency. The ratio or relative frequency is the percentage of people in each group.
MEDIAN PERCENTILE Another way to calculate the middle of a numerical data set is the median. After you have sorted the data from small to big, the middle number is the median. The following steps must be taken to determine the median: Percentiles are a means to evaluate a number in comparison to all other data values. You get an actual raw score and a percentile when you take a standardised exam. For example, 90% of all students’ assessments are the same as you do or below you if you get the 90th percentile (and 10 per cent are above yours). Generally speaking, k% of the data is at or below the kth-percentile, and (100 – k) per cent is above it. 1. 2. Rank the smallest to the biggest numbers. Pick the one that appears precisely in the middle with a weird amount of numbers. You also labelled the median. Take the two numbers exactly in the centre and sum to calculate the median for even numbers. 3.
DESCRIPTIVE STATISTICS VARIABLES The data collected showed the number of injuries in a hospital or the number of patients with diabetes in descriptive figures. However, you would like to believe that the relevant data has not been collected in some instances. You’ll want to generalise this conclusion to the whole population in wounds. These are characteristics of the population under study. Such as the number or colour of wounds, gender, age, body mass index (BMI), etc. According to four distinct measuring values, variables may be measured. Nominal amounts are the lowest level of measurement. To categorise characteristics, they require numbers to be allocated. Such as women and men. While it is possible to use numbers in small units, they cannot be treated mathematically.
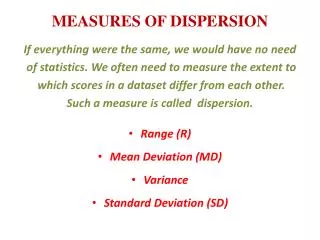
DISTRIBUTION AVERAGES Data is summarised after obtaining it in various ways. Next, from the frequency distribution of the variables, a general definition of the data can be explored. Significant is the distribution form for interval and ratio variables. It is a perfect way to get an insight into the data and simple trends by using this form of a frequency distribution in the introduction to statistics. However, a frequency table or figure cannot be rendered for all variables. These distributions are so often used that they are assigned odd names. Normal distribution means that the values are distributed in the middle of the measured value range. As a consequence, the results are derived in one single score per element. The result is by calculating the average. The average measure is the most commonly used, calculated by dividing the number of scores. Fashion and medium are other indicators of core themes.
INFERENTIAL STATISTICS Once you have explained the findings, the finding can give more assumptions. Many tests just test a population group so that you would like a wider population. Inferential attributes are being used in guessing the traits of individuals.
SAMPLE Various samples are available. Such as a probability sample, a plain random sample, a laminated sample or a system sample. It is beyond this article’s reach to address all types of pieces. However, it is necessary to note that a study should be adaptive to the analysis goal. For e.g., if you would like to talk about the occurrence of a trait in a population, you should provide a representative population sample. It is more important that all potential values in each variable be available in the sample if you wish to draw an inference about relationships.
BOOST EARNINGS AND MARCH AHEAD OF YOUR CAREER Become a Subject Expert with CHEGG SIGN UP NOW