Download
1 / 24
240 likes | 330 Views
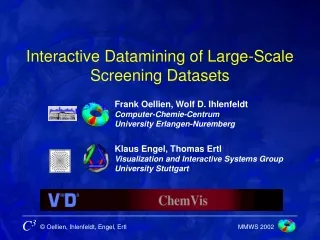
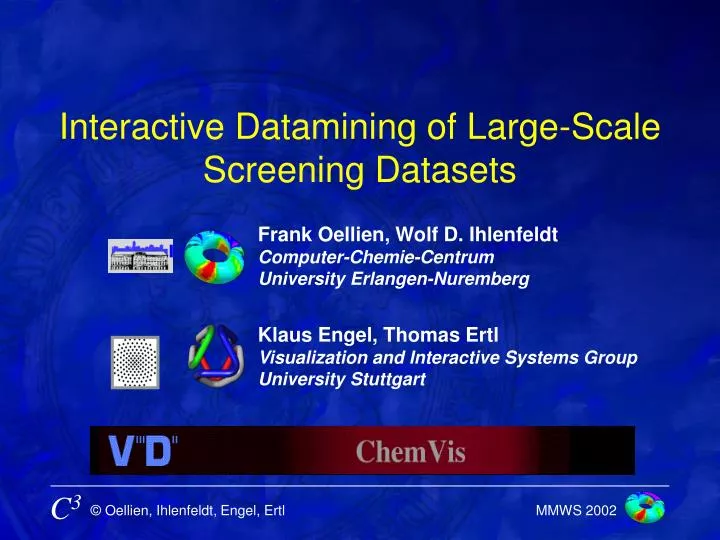
Interactive Datamining of Large-Scale Screening Datasets. Frank Oellien, Wolf D. Ihlenfeldt Computer-Chemie-Centrum Universit y Erlangen-Nuremberg. Klaus Engel, Thomas Ertl Visualization and Interactive Systems Group Universit y Stuttgart. Overview.

E N D
Interactive Datamining of Large-Scale Screening Datasets Frank Oellien, Wolf D. Ihlenfeldt Computer-Chemie-Centrum University Erlangen-Nuremberg Klaus Engel, Thomas ErtlVisualization and Interactive Systems Group University Stuttgart
Overview • Multi-variate and multi-dimensional datasets • Motivation • Information Visualization Techniques • Examples (ChemCodes Inc., NCI) • Demo
Overview • Multi-variate and multi-dimensional datasets • Motivation • Information Visualization Techniques • Examples (ChemCodes Inc., NCI) • Demo
Chemical data 18000000 16000000 Merck Katalog Synopsys PG 14000000 ACX 12000000 NCI DTP 10000000 ChemInform 8000000 Spresi 6000000 Beilstein 4000000 CAS Current datasets 2000000 0
Multi-Variate and Multi-Dimensional Numeric Datasets Today • Change in chemical synthesis technology • new technologies (HTS, combinatorial synthesis) • experiments generate terabytes of data per year • development of data mining and visualization tools could not keep pace • most critical bottleneck in R&D today ! • tools for interactive mining and information visualization are needed
Tools for Interactive Visualization of Multi-Variate and Multi-Dimensional Data • Standard applications • barchart, 2D and pseudo 3D scatter plots, molecular spreadsheets • limited to small subsets • platform-dependent • Our goal: applications that are • simple to use • allow straightforward interpretation of results • generalized access to tabular numeric data • platform-independent
Overview • Multi-variate and multi-dimensional datasets • Motivation • Information Visualization Techniques • Examples (ChemCodes Inc., NCI) • Demo
3D Tools for Interactive Information Visualization • Information Visualization Applications that uses 3D capabilities of modern clients • Glyph-based InfVis approaches • Volume-based InfVis approaches
Glyph-based InfVis Tools • 3 orthogonal axes • color • shape • size • transparency • surface effects • animation • up to ~100 Glyphs
Java/Java3D InfVis Applet • Java3DCanvas • Tool Panel • (filters, selection tools, details) • ControlPanel
Java/Java3D InfVis Applet3D Render Panel • 3D Glyphs • 3D Barchart
Dynamic Filter Tools • Selection Tools • Detail Tools Java/Java3D InfVis Applet3D Tool Panel
Advantages of Volume-based InfVis Tools • Databases with millions of data points • Glyph-based InfVis approaches • produce millions of geometricprimitives • interactive visualization not possible • Volume-based InfVis approaches • can handle large number of data points • interactive visualization using low-cost graphics hardware is possible
Overview • Multi-variate and multi-dimensional datasets • Motivation • Information Visualization Techniques • Examples (ChemCodes Inc., NCI) • Demo
ChemCodes Reaction Database • 100 most important FGs ~75% chemistry • 100 standard reactions • Limits of standard reactions • Functional Group Compatibility • Generating Rules • Goal: Analysis of the reaction space
ChemCodes - Reaction Optimization I • Goal: Reaction Optimization: > 95% Yield • 7 Dimensions:reagent, solvent, time, temperature,stoichiometry,reagent order,FG-compatibility
ChemCodes - Reaction Planning • FunctionalGroupCompatibilityCheck
Example 2: NCI Anti-tumor / Anti-viral Database • Initiated in April 1990 (modified 1994) • ~ 250.000 compounds • ~ 30.000 with anti-tumor screening data • Enhanced NCI Database Browser • > 30 different molecular properties • up to 23 3D conformers per compound
Overview • Multi-variate and multi-dimensional datasets • Motivation • Information Visualization Techniques • Examples (ChemCodes Inc., NCI) • Demo
Acknowledgment • Prof. Johann GasteigerComputer-Chemie-CentrumUniversity of Erlangen-Nuremberg • Prof. Thomas Ertl, Dipl. Inf. Klaus Engel Visualization and interactive SystemsUniversity of Stuttgart • Dr. Patrick Kiser, Dr. Gary Eichenbaum ChemCodes Inc. • Marc NicklausLaboratory of Medicinal ChemistryNCI, NIH • Deutsche Forschungsgemeinschaft