Download
1 / 24
240 likes | 317 Views
CV Border Wait-Time Measurement Project Presentation to: TBWG Data Workshop Romulus, Michigan (June3, 2008) Coordination and Policy Branch Transport Canada Ontario Region. Project Research & Development Process. Phase 1: Initial Research and Facilitation

E N D
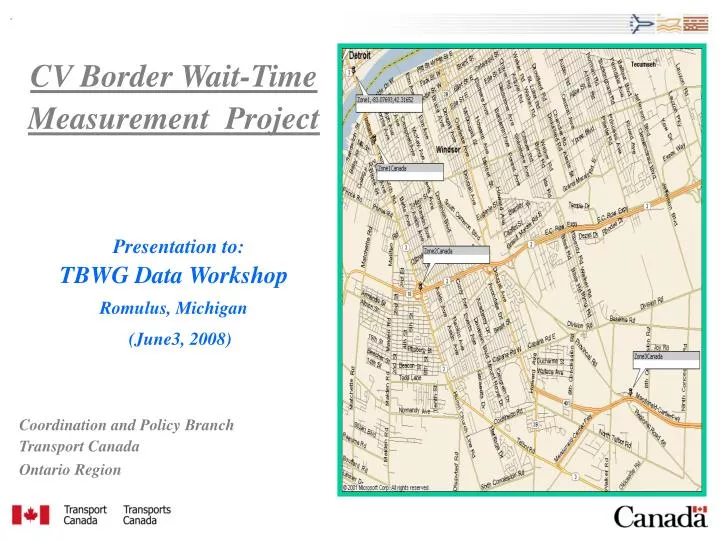
CV Border Wait-Time Measurement Project Presentation to: TBWG Data Workshop Romulus, Michigan (June3, 2008) Coordination and Policy Branch Transport Canada Ontario Region
Project Research & Development Process • Phase 1: Initial Research and Facilitation • review/assessment of technology options, • secure endorsement & support of related interests, including OTA & partner carriers Conclusions: • tractor logs are a rich/abundant source of empirical data on wait-times & delays throughout the entire O/D trip, be it at border crossings, or shippers/receivers yards, • such wait-time data can be accessed, processed and compiled in readily useable form. • the capability to vary the frequency of the polling interval makes truck-mounted GPS units the technology option best suited for measuring narrowly-defined border crossing intervals Completed: May, 2003 • Phase 2: Formal Proof of Concept • demonstrate practical ways and means to exploit the inherent, technical functionality of GPS-based, E-data recorders (i.e. hindcast simulations on archival data logs) • assess the costs, and overall cost effectiveness, of advancing the project from concept to “live-time” implementation, with a broad-based and expanded sample size Completed: October, 2004 • Phase 3: Implementation …… Operation • RDG approval to proceed with implementation granted October, 2005 • project conceived as a two (2) year, or 26-month, research & demonstration effort. Project TEC, $240,948.00, including acquisition and deployment of 86 GPS probe-units, plus data management/service fees, to the end of ‘07/08 fiscal year • contract formally awarded to Turnpike Global Technologies (TGT) Ltd. on January 20, 2006
CV BWT Measurement Project: Technology Mix Data Logging Data Transmission Data Processing [download logs] [transmit logs] INTERNET [broadcast signal] [progrm’ng instructions] • On-board GPS unit • [geo-coordinates & time stamps] • detailed digital fingerprint • precise interval measure • Bluetooth Reader • [data access point] • alsoreads Bluetooth ID’s • instant transmission • at $0 cost • TGT Ltd. • [data m’gmt service provider] • purpose-built algorithms • 24/7 BWT data stream • Web-based access
Site Layout: Data Access Points and Interior Geofences Peace Bridge Canadian Plaza PlazaEntry Inset: U.S. Plaza Duty Free Overflow Base Stn. Reader 2nd’ry
CV BWT Web Display www.borderinformation.com userID: peaceb password: peaceb123
The Distribution ……. and limits ……. of the BWT Crossings Data • # of Participant Carriers: • 15 at outset, currently > 50 • Crossing observations to date: FY 2006/07 (97,000), FY 2007/08 (124,260) • Probe Unit leverage …..30 test units prompted installation of > 1300 units by 3 “host” carriers • Re: ……the Volume & Distribution of Crossings • the data set will , , as Service Provider’s client base, or market share, ’s, ’s. • the number & location of crossings ……. vary independently, as determined by carrier operations • the composition, or commodity mix, of carriers includes, food, auto-parts, automotive, TL & LTL freight, but varies independently as determined by the fleet size and/or service lines of (TGT) client carriers. • sample carriers are predominantly CTPAT/FAST certified; however, the BWT crossing observations are not fully differentiated by custom classification ….as yet !!! • BWT data as % of Total Traffic Volume • 60-90 observations per weekday at P.Bridge and A.Bridge, >1% of annual CV traffic volume at each respective crossing. • daily observations at Q/L and BWB are appreciably less, 15-20/peak weekday • the BlueTooth externality: 320-340 observations/day at DWT, equals 2%+ of total (’07) traffic volume (i.e., cars/trucks/bus)
PAX Vehicle BWT Measurement : Exploiting Bluetooth Functionality Data Logging Data Transmission Data Processing “ ….. here I am” [ sends outbound message] DIGITAL HANDSHAKE INTERNET CONNECTION “ …. who’s out there” [programming instructions] • Bluetooth enabled device • [handheld, or embedded] • emits unique Bluetooth ID • variable range (300/30/3) depending on device • Bluetooth Transceiver • [data access point] • operates in discovery mode • sends outbound messages only • microprocessor assigns coordinates & timestamps • TGT Ltd. • [data m’gmt service provider] • purpose-built algorithms • 24/7 BWT data stream • Web-based access
Peace Bridge (US Bound): ACE Roll-OUT Daily Diagnostic (Sept 21’06 – Oct 5’06)
Bluewater Bridge (US Bound): Mean Crossing Time Q1 08/09 v. FY 07/08
AMBASSADOR BRIDGE Peak Crossing Time v. Peak Traffic Volume AMBASSADOR BRIDGE Peak Crossing Time v. Peak Traffic Volume
PEACE BRIDGE Peak Crossing Time v. Peak Traffic Volume PEACE BRIDGE Peak Crossing Time v. Peak Traffic Volume
Ambassador Bridge (US Bound) Access & Queuing Patterns • Zone 2 + Zone 1: • Hwy 401 to A. Bridge Plaza • Queue length ………. @ 16 km • 43.3% of recorded observations • Mean Transit Time • Zone 1 only: • ECR Parkway to A. Bridge Plaza • (access to Huron Church via ECR) • Queue length ……. @ 6km • 32.9% of recorded observations • Mean Transit Time • NO Zone: • access to Plaza via Wyandotte Street • Queue length ……0 km • 23.8 % of recorded observations • Mean Transit Time
Apart from the data, remember three (3) fundamental, STRATEGIC, aspects of this seminal R&D effort : • This is not a SOLUTION, simply an analytical TOOL: • a PERFORMANCE METRIC, with operational utility for local port & crossing officials, a variety of government agencies, and • those (partner) carriers, who can now routinelytrack& precisely measure their own day-day border crossing activity • This is industry-driven, industry-focused data, never previously available, clearly demonstrating: • the trucking industry’s willingness to partner with government to explore new, innovative approaches to problems that affect their mutual interest, • that industry itself is taking a direct hand, and now able to provide empirical data in response to the concerns or “perceptions” of shippers, foreign investors, etc. regarding the Can/US border. • This project, as a R&D initiative, has “opened the door” to further exploitation of an increasingly abundant, and previously untapped, digital data resource: • established the technical and economic viability of FARMING digital tractor logs, • confirms “Bluetooth” functionality as a proxy for PAX TRAFFIC wait-times at Can/US border crossings, • the BWT application is simply a “special case” of the emerging interest in digital tractor logs as a planning/analysis tool for trade corridors (MTO, TC/HQ) and urban corridor (MTO, UofT). • Already we are seeing the emergence of a data resale, or procurement, market for 3rd-party, derivative applications.