Download
1 / 39
390 likes | 508 Views
Quantifying Cement Systems using Image Analysis. Colin Leung Cement Chemistry Team December 13 th , 2011. Contents. Introduction Purpose of Investigation Sample Information and Preparation Procedures Image Analysis Algorithms: Particle-Based Grey Level Segmentation

E N D
Quantifying Cement Systems using Image Analysis Colin Leung Cement Chemistry Team December 13th, 2011
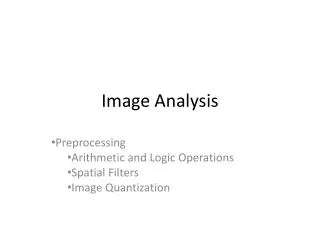
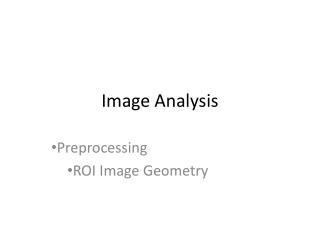
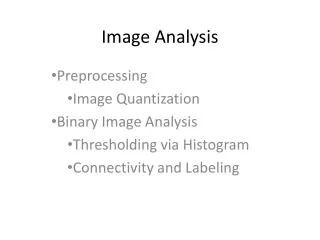
Contents • Introduction • Purpose of Investigation • Sample Information and Preparation Procedures • Image Analysis Algorithms: • Particle-Based Grey Level Segmentation • Particle-Based Morphological Segmentation • Particle-Based EDS Data Corroboration • Conclusion
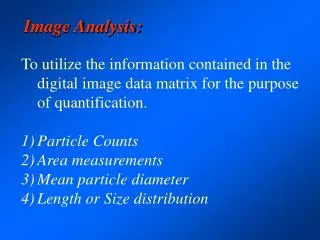
Introduction • Want to analyze mass percentages and particle size distributions (milling characteristics) of the phases that make up commercial cement, which heavily influence its physicochemical characteristics
Potential Applications Basis for additional research that depends on mass percentages or particle size distributions (i.e. hydration product, clinker size research): • Investigate competing cement formulas • Improve quality control for cement manufacturing processes such as milling
EDS Segmentation Simple Grey Level Segmentation EDS SEM BEI
Simple Grey Level Segmentation Problems • Cross-section polishing artefacts • Electro-magnetic distortion
EDS Segmentation Problems • Large range of chemical compositions in phases such as fly ash • Many kinds of crystal minerals, each with their own chemical composition • Difficult to segment phases if fly ash has similar chemical composition to slag or clinker • Cannot accurately measure particles smaller than 1 micrometer
Purpose of Investigation Simple Grey Level Segmentation and EDS Segmentation are not accurate enough, can only implement simple segmentation classes based on pre-calculated information Create new image analysis algorithms to segment the phases using more complex information and methods: • Particle-Based Grey Level Method • Particle-Based Morphological Method • Particle-Based EDS Data Corroboration (New capability)
Sample Information and Preparation Procedures Particle-Based Grey Level Segmentation: • Clinker (57% mass) + Gypsum (3) + 4500 cm2/g Blaine Slag (40) Particle-Based Morphology Segmentation: • Clinker (70) + Japanese Fly Ash (30) Preparation Procedures: • Immersed in resin medium • Polished using cross-section polishing machine • Carbon covered for SEM-EDS measurements • At least 10 BEI images taken at 500X magnification for image analysis
Particle-Based Grey Level Segmentation Principle Images should be segmented by grey level in terms of particles, not pixels
Raw Image Particle Extraction Pixel Classification Particle Classification Phase Images Back-scattered Electron Image of Clinker and Slag 4500 Sample with Enlarged Particle
Raw Image Particle Extraction Pixel Classification Particle Classification Number of Pixels Phase Images Grey Level Value Histogram of Sample Image with Phase Grey Level Thresholds
Raw Image Particle Extraction Pixel Classification Particle Classification Phase Images Grey Level Segmented Sample Image with Enlarged Particle
Raw Image Particle Extraction Pixel Classification Particle Classification Number of Pixels Phase Images Grey Level Value Histogram of Sample Image with the Particle Grey Level Threshold
Raw Image Particle Extraction Pixel Classification Particle Classification Phase Images Particle Segmented Sample Image with Enlarged Particle
Raw Image Particle Extraction Pixel Classification Particle Classification Particle is classified as the phase with the highest area percentage. So this particle is categorized as slag. Phase Images
Raw Image Particle Extraction Pixel Classification Particle Classification Phase Images Sample Image with Enlarged Particle (slag outlined in red)
Raw Image Particle Extraction Pixel Classification Particle Classification Phase Images Slag Only Sample Image with Enlarged Particle
Particle-Based Morphological Segmentation Principle Particles can separated in terms of morphology, not just grey level
Resin Particle Number of Pixels Grey Level Value Histogram of Sample Image with the Particle Grey Level Threshold
Circularity = 0.951 Circularity = 0.631
Circularity = 0.433 Circularity = 0.960 Hole Circularity Filtered Sample Image with Enlarged Particle Image
Accurate results for clinker + Japanese fly ash sample • Other samples have yet to be investigated
III. Particle-Based EDS Data Corroboration (Part I + Part II + EDS)
New Capabilities • Can compare both image analysis and EDS data (i.e. average grey level and chemical composition) in a single algorithm, which enables us to achieve more accurate results + Image Analysis EDS
Conclusion • Can now measure complex features of particles such as hole circularity or particle area percentages • Particle-based grey level and morphological segmentation show great improvements in accuracy when measuring phase mass percentages and particle size distributions • Accuracy and efficiency can be improved by combining both image analysis and EDS data
Image Analysis Issues • Accurate particle extraction • Minimum particle sample size for accurate results • Optimal image magnification