Download
1 / 1
10 likes | 120 Views
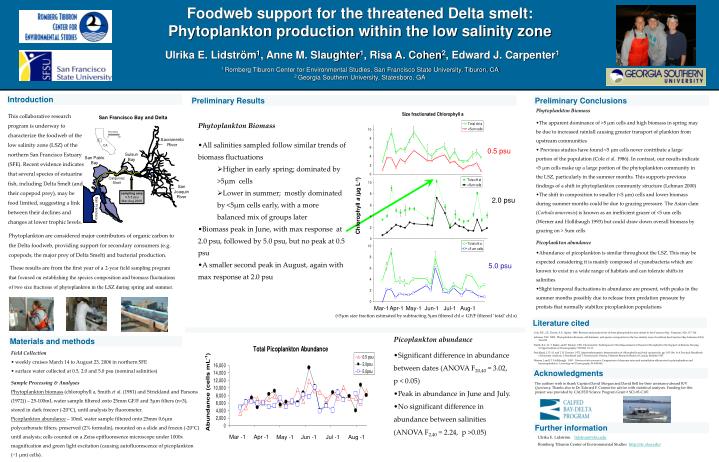
Foodweb support for the threatened Delta smelt: Phytoplankton production within the low salinity zone Ulrika E. Lidström 1 , Anne M. Slaughter 1 , Risa A. Cohen 2 , Edward J. Carpenter 1 1 Romberg Tiburon Center for Environmental Studies, San Francisco State University, Tiburon, CA

E N D
Foodweb support for the threatened Delta smelt: Phytoplankton production within the low salinity zone Ulrika E. Lidström1, Anne M. Slaughter1, Risa A. Cohen2, Edward J. Carpenter1 1 Romberg Tiburon Center for Environmental Studies, San Francisco State University, Tiburon, CA 2 Georgia Southern University, Statesboro, GA 0 20 San Francisco Bay and Delta Kilometers Sacramento River 0.5 psu CA San Pablo Bay Suisun Bay Carquinez Strait San Joaquin River 2.0 psu sampling area 0.5-5 psu Mar-Aug 2006 Chlorophyll a (µg L-1) San Francisco 5.0 psu Aug-1 Mar-1 Apr-1 May-1 Jun-1 Jul-1 Mar -1 Apr -1 May -1 Jun -1 Jul -1 Aug -1 Introduction Preliminary Results Preliminary Conclusions • Phytoplankton Biomass • The apparent dominance of >5 µm cells and high biomass in spring may be due to increased rainfall causing greater transport of plankton from upstream communities • Previous studies have found <5 µm cells never contribute a large portion of the population (Cole et al. 1986). In contrast, our results indicate <5 µm cells make up a large portion of the phytoplankton community in the LSZ, particularly in the summer months. This supports previous findings of a shift in phytoplankton community structure (Lehman 2000) • The shift in composition to smaller (<5 µm) cells and lower biomass during summer months could be due to grazing pressure. The Asian clam (Corbula amurensis) is known as an inefficient grazer of <5 um cells (Werner and Hollibaugh 1993) but could draw down overall biomass by grazing on > 5um cells • Picoplankton abundance • Abundance of picoplankton is similar throughout the LSZ. This may be expected considering it is mainly composed of cyanobacteria which are known to exist in a wide range of habitats and can tolerate shifts in salinities • Slight temporal fluctuations in abundance are present, with peaks in the summer months possibly due to release from predation pressure by protists that normally stabilize picoplankton populations This collaborative research program is underway to characterize the foodweb of the low salinity zone (LSZ) of the northern San Francisco Estuary (SFE). Recent evidence indicates that several species of estuarine fish, including Delta Smelt (and their copepod prey), may be food limited, suggesting a link between their declines and changes at lower trophic levels. • Phytoplankton Biomass • All salinities sampled follow similar trends of biomass fluctuations • Higher in early spring; dominated by >5µm cells • Lower in summer; mostly dominated by <5µm cells early, with a more balanced mix of groups later • Biomass peak in June, with max response at 2.0 psu, followed by 5.0 psu, but no peak at 0.5 psu • A smaller second peak in August, again with max response at 2.0 psu Phytoplankton are considered major contributors of organic carbon to the Delta foodweb, providing support for secondary consumers (e.g. copepods, the major prey of Delta Smelt) and bacterial production. These results are from the first year of a 2-year field sampling program that focused on establishing the species composition and biomass fluctuations of two size fractions of phytoplankton in the LSZ during spring and summer. (<5µm size fraction estimated by subtracting 5µm filtered chl a GF/F filtered ‘total’ chl a) Literature cited Cole, B.E., J.E. Cloern, A.E. Alpine. 1986 Biomass and productivity of three phytoplankton size classes in San Francisco Bay. Estuaries, 9(2): 117-126 Lehman, P.W. 2000. Phytoplankton biomass, cell diameter, and species composition in the low salinity zone of northern San Francisco Bay Estuaries 23(2): 216-230 Smith, R.C., K. S. Baker, and P. Dustan. 1981. Fluorometric Techniques for the Measurement of Oceanic Chlorophyll in the Support of Remote Sensing. Scripps Institute of Oceanography: SIO Ref. 81-17. Strickland, J. D. H. and T. R. Parsons. 1972. Spectrophotometric determination of chlorophylls and total carotenoids, pp. 185-196, In A Practical Handbook of Seawater Analysis, J. Strickland and T. Parsons (ed). Ottawa, Fisheries Research Board of Canada, Bulletin #167. Werner, I and J.T. Hollibaugh. 1993. Potamocorbula amurensis: Comparison of clearance rates and assimilation efficiencies for phytoplankton and bacterioplankton. Limnology and Oceanography 38: 949-964 • Picoplankton abundance • Significant difference in abundance between dates (ANOVA F20,40 = 3.02, p < 0.05) • Peak in abundance in June and July. • No significant difference in abundance between salinities (ANOVA F2,40 = 2.24, p >0.05) Materials and methods Field Collection • weekly cruises March 14 to August 23, 2006 in northern SFE • surface water collected at 0.5, 2.0 and 5.0 psu (nominal salinities) Sample Processing & Analyses Phytoplankton biomass (chlorophyll a, Smith et al. (1981) and Strickland and Parsons (1972)) – 25-100mL water sample filtered onto 25mm GF/F and 5µm filters (n=3), stored in dark freezer (-20°C), until analysis by fluorometer. Picoplankton abundance – 10mL water sample filtered onto 25mm 0.6µm polycarbonate filters, preserved (2% formalin), mounted on a slide and frozen (-20°C) until analysis; cells counted on a Zeiss epifluoresence microscope under 1000x magnification and green light excitation (causing autofluorescence of picoplankton (~1 µm) cells). Acknowledgments The authors wish to thank Captain David Morgan and David Bell for their assistance aboard R/V Questuary. Thanks also to Dr. Edward F. Connor for advice with statistical analyses. Funding for this project was provided by CALFED Science Program Grant # SCI-05-C107. Further information Ulrika E. Lidström lidstrom@sfsu.edu Romberg Tiburon Center of Environmental Studies http://rtc.sfsu.edu/