Download
1 / 49
520 likes | 747 Views
5-2 What Limits the Growth of Populations? . Concept 5-2 No population can continue to grow indefinitely because of limitations on resources and because of competition among species for those resources. . Most Populations Live Together in Clumps or Patches (1).

E N D
5-2 What Limits the Growth of Populations? • Concept 5-2 No population can continue to grow indefinitely because of limitations on resources and because of competition among species for those resources.
Most Populations Live Together in Clumps or Patches (1) • Population: group of interbreeding individuals of the same species • Population distribution • Clumping • Uniform dispersion • Random dispersion
Most Populations Live Together in Clumps or Patches (2) • Why clumping? • Species tend to cluster where resources are available • Groups have a better chance of finding clumped resources • Protects some animals from predators • Packs allow some to get prey
Population of Snow Geese Fig. 5-11, p. 112
Generalized Dispersion Patterns Fig. 5-12, p. 112
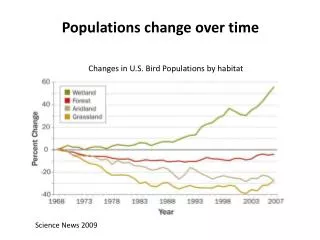
Populations Can Grow, Shrink, or Remain Stable (1) • Population size governed by • Births • Deaths • Immigration • Emigration • Population change = (births + immigration) – (deaths + emigration)
Populations Can Grow, Shrink, or Remain Stable (2) • Age structure • Pre-reproductive age • Reproductive age • Post-reproductive age
Some Factors Can Limit Population Size • Range of tolerance • Variations in physical and chemical environment • Limiting factor principle • Too much or too little of any physical or chemical factor can limit or prevent growth of a population, even if all other factors are at or near the optimal range of tolerance • Precipitation • Nutrients • Sunlight, etc
Trout Tolerance of Temperature Fig. 5-13, p. 113
No Population Can Grow Indefinitely: J-Curves and S-Curves (1) • Size of populations controlled by limiting factors: • Light • Water • Space • Nutrients • Exposure to too many competitors, predators or infectious diseases
No Population Can Grow Indefinitely: J-Curves and S-Curves (2) • Environmental resistance • All factors that act to limit the growth of a population • Carrying capacity (K) • Maximum population a given habitat can sustain
No Population Can Grow Indefinitely: J-Curves and S-Curves (3) • Exponential growth • Starts slowly, then accelerates to carrying capacity when meets environmental resistance • Logistic growth • Decreased population growth rate as population size reaches carrying capacity
Logistic Growth of Sheep in Tasmania Fig. 5-15, p. 115
2.0 Population overshoots carrying capacity Carrying capacity 1.5 Population recovers and stabilizes Population runs out of resources and crashes Number of sheep (millions) 1.0 Exponential growth .5 1800 1825 1850 1875 1900 1925 Year Fig. 5-15, p. 115
2.0 Population overshoots carrying capacity Carrying capacity 1.5 Population recovers and stabilizes Population runs out of resources and crashes Number of sheep (millions) 1.0 Exponential growth .5 1800 1825 1850 1875 1900 1925 Year Fig. 5-15, p. 115
Science Focus: Why Do California’s Sea Otters Face an Uncertain Future? • Low biotic potential • Prey for orcas • Cat parasites • Thorny-headed worms • Toxic algae blooms • PCBs and other toxins • Oil spills
Population Size of Southern Sea Otters Off the Coast of So. California (U.S.) Fig. 5-B, p. 114
Case Study: Exploding White-Tailed Deer Population in the U.S. • 1900: deer habitat destruction and uncontrolled hunting • 1920s–1930s: laws to protect the deer • Current population explosion for deer • Spread Lyme disease • Deer-vehicle accidents • Eating garden plants and shrubs • Ways to control the deer population
Mature Male White-Tailed Deer Fig. 5-16, p. 115
When a Population Exceeds Its Habitat’s Carrying Capacity, Its Population Can Crash • A population exceeds the area’s carrying capacity • Reproductive time lag may lead to overshoot • Population crash • Damage may reduce area’s carrying capacity
Exponential Growth, Overshoot, and Population Crash of a Reindeer Fig. 5-17, p. 116
Population overshoots carrying capacity 2,000 1,500 Population crashes Number of reindeer 1,000 Carrying capacity 500 0 1910 1920 1930 1940 1950 Year Fig. 5-17, p. 116
Species Have Different Reproductive Patterns (1) • Some species • Many, usually small, offspring • Little or no parental care • Massive deaths of offspring • Insects, bacteria, algae
Species Have Different Reproductive Patterns (2) • Other species • Reproduce later in life • Small number of offspring with long life spans • Young offspring grow inside mother • Long time to maturity • Protected by parents, and potentially groups • Humans • Elephants
Under Some Circumstances Population Density Affects Population Size • Density-dependent population controls • Predation • Parasitism • Infectious disease • Competition for resources
Several Different Types of Population Change Occur in Nature • Stable • Irruptive • Population surge, followed by crash • Cyclic fluctuations, boom-and-bust cycles • Top-down population regulation • Bottom-up population regulation • Irregular
Population Cycles for the Snowshoe Hare and Canada Lynx Fig. 5-18, p. 118
160 Hare Lynx 140 120 100 80 Population size (thousands) 60 40 20 0 1845 1855 1865 1875 1885 1895 1905 1915 1925 1935 Year Fig. 5-18, p. 118
Humans Are Not Exempt from Nature’s Population Controls • Ireland • Potato crop in 1845 • Bubonic plague • Fourteenth century • AIDS • Global epidemic
Chapter 6 The Human Population and Its Impact
6-1 How Many People Can the Earth Support? • Concept 6-1 We do not know how long we can continue increasing the earth’s carrying capacity for humans without seriously degrading the life-support system that keeps us and many other species alive.
Core Case Study: Slowing Population Growth in China: A Success Story • 1.3 billion people • Promotes one-child families • Contraception, abortion, sterilization • Fast-growing economy • Serious resource and environmental problems
Crowded Street in China Fig. 6-1, p. 125
Human Population Growth Continues but It Is Unevenly Distributed (1) • Reasons for human population increase • Movement into new habitats and climate zones • Early and modern agriculture methods • Control of infectious diseases through • Sanitation systems • Antibiotics • Vaccines • Health care • Most population growth over last 100 years due to drop in death rates
Human Population Growth Continues but It Is Unevenly Distributed (2) • Population growth in developing countries is increasing 9 times faster than developed countries • 2050 • 95% of growth in developing countries • 7.8-10.8 billion people • Should the optimum sustainable population be based on cultural carrying capacity?
Human Population Growth Fig. 1-18, p. 21
2.5 2.0 1.5 Average annual global growth rate (percent) 1.0 0.5 0.0 1950 1970 1990 2010 2030 2050 Year Fig. 6-2, p. 127
Population Time Line: 10,000 BC - 2042 Figure 3, Supplement 9
Annual Growth Rate of World Population, 1950-2010 Fig. 6-2, p. 127
Where Population Growth Occurred, 1950-2010 Fig. 6-3, p. 127
10 9 8 7 World population (in billions) 6 5 4 Population in less-developed countries 3 2 1 Population in more-developed countries 0 1950 1960 1970 1980 1990 2000 2010 2020 2030 2040 2050 Year Fig. 6-3, p. 127
Five Most Populous Countries, 2010 and 2050 Fig. 6-4, p. 127
2010 China 1.3 billion India 1.2 billion United States 310 million Indonesia 235 million Brazil 193 million 2050 India 1.7 billion China 1.4 billion United States 439 million Pakistan 335 million Indonesia 309 million Fig. 6-4, p. 127
11 UN high-fertility variant (2008 revision) U.S. Census Bureau (2008 update) UN medium-fertility variant (2008 revision) 10 IIASA (2007 update) UN low-fertility variant (2008 revision) 9 World population (in billions) 8 7 6 2010 2020 2030 2040 2050 Year Fig. 6-A, p. 128
Science Focus: Projecting Population Change • Why range of 7.8-10.8 billion for 2050? • Demographers must: • Determine reliability of current estimates • Make assumptions about fertility trends • Deal with different databases and sets of assumptions
World Population Projections to 2050 Fig. 6-A, p. 128
Science Focus: How Long Can The Human Population Keep Growing? • Thomas Malthus and population growth: 1798 • Overpopulation and overconsumption • Will technology increase human carrying capacity? • Can the human population grow indefinitely?
Natural Capital Degradation: Altering Nature to Meet Our Needs Fig. 6-B, p. 129
Natural Capital Degradation Altering Nature to Meet Our Needs Reducing biodiversity Increasing use of net primary productivity Increasing genetic resistance in pest species and disease-causing bacteria Eliminating many natural predators Introducing harmful species into natural communities Using some renewable resources faster than they can be replenished Disrupting natural chemical cycling and energy flow Relying mostly on polluting and climate-changing fossil fuels Fig. 6-B, p. 129