Download
1 / 39
430 likes | 648 Views
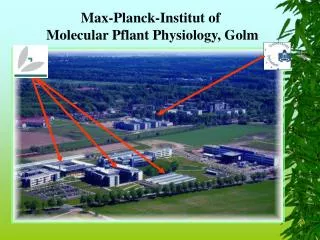
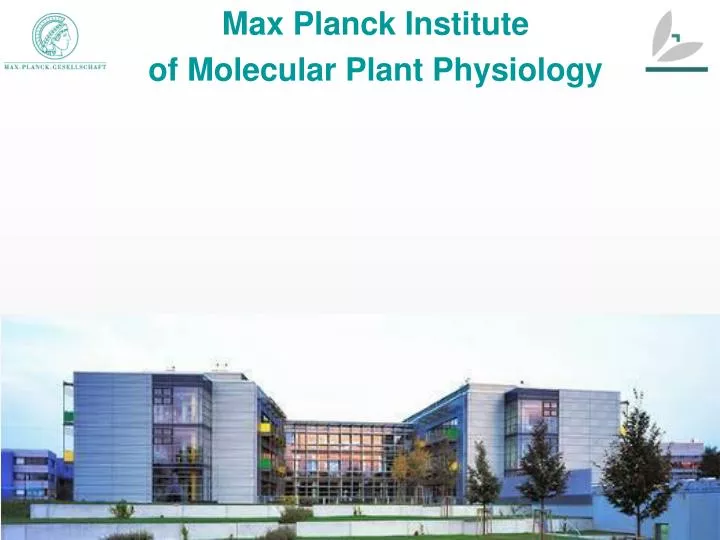
Max Planck Institute of Molecular Plant Physiology. http://www.mpimp-golm.mpg.de. Nature 433, 6 th January 2005, p.12. .. journey southwest from Berlin to Golm, a small village near Potsdam, is a 90- minute train trip to the end of the world …

E N D
Max Planck Institute of Molecular Plant Physiology
http://www.mpimp-golm.mpg.de Nature 433, 6th January 2005, p.12 .. journey southwest from Berlin to Golm, a small village near Potsdam, is a 90- minute train trip to the end of the world … ………. outside Potsdam the only view from the window is farmland stretching to the horizon, until an ultra-modern glass building looms out of the fog. Thank You
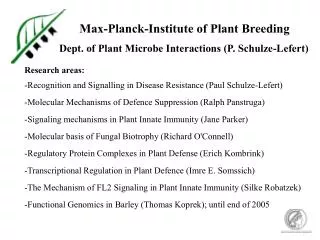
Structure of MPI-MP 3 departments comprising 12 departmental research groups mostly led by young scientists, all now qualified as ‚Research Group Leader‘ 2 independent junior research groups, funded by the MPG 3 central infrastructure groups (expression profiling, metabolite profiling, bioinformatics) 3 service units (plant growth, microscopy, biophysics) 2 university guest groups + 2 GoFORSYS guest groups Horizontal structure - with independence for groups led by (time-limited) young scientists
Admin. service Directors & Group Leaders 5% 5% Scientific service 19% Post Docs 33% 12% Students -masters -working 26% PhD Students Personnel 2010 Women in science: - 52 % of the PhD students - 34 % of the post-docs - 18 % of the group leaders Internationality: - 39 % of the PhD students - 65 % of the post-docs - 24 % of the group leaders
Internationality • Internationality: • - 39 % of the PhD students • - 65 % of the post-docs • 24 % of the group leaders • 33% of the Directors Internationality is atmosphere and environment, not just counting heads 32 different countries … Poland (20) South America (12), esp. Brazil, Argentina, Chile, Mexico China (11) India (7), Nepal (4) Australia (3), New Zealand (2) Macedonia (3) • English is the official institute language • - all talks and seminars • all information, operating instructions • safety and other papers • - the new institute intranet / sharepoint • - work contracts • Temporary accommodation • on Campus, or in Golm • Help where possible with the authorities
The main biological question Flowers Seeds Young leaves Light CO2 Nutrients Water Roots What determines plant growth and composition? Our entry point A complex integrated process Many entry points for research Developmental regulation - Meristem activity - Cell cycle - Cell growth Metabolism • Biophysics • Water movement • Cell expansion and the biogenesis and use of machinery that is needed to turn metabolites into biomass e.g. chloroplasts, ribosomes, cellulose synthase Whole plant allocation - leaf area /unit biomass - root volume /unit biomass ….. using systems approaches
Bioinformatics Huge amounts of data Many different sorts of data Environmental conditions Multilevel Analysis Systems Biology Rigorous conceptual analysis Molecular traits Metabolic traits Physiological traits Integrative traits Evolution of Research Strategies Time series Multiple steady states • Genetically differing plants • - Natural Diversity • Gene Technology • nuclear • plastome Basic understanding, Biotechnology, Breeding, Biomarkers
Metabolomics • The metabolome comprises all small molecules present in a given biological system • Metabolomics aims at the quantitative determination of all small molecules • The metabolome contains molecules hugely varying in three parameters : concentration, structure and chemical behaviour
Data acquisitionDTD – GC/TOF: high throughput, high quality~ 200 primary metabolites robotic derivatisation & full extract injection:no fractionation, no cross contamination, reproducibility <10%RSD
LTQ FT Ultra • Resolution • > 1 000 000 • Mass Range • m/z 50-2000 • Dynamic Range • 1 000
Mass Accuracy 0.26 ppm + 0.00004 102 ppm - 0.017 5.93 ppm - 0.00103 Phenylalanine [M+H+]+
Formula calculation is depending on mass accuracy and resolution [M+H+]+ Mass 181.07066 allowed chemical elements: C = 30 H = 50 N = 5 O = 10 P = 5 S = 5 500 ppm = 0.09085 Da Error 268 predicted Formulas 100 ppm = 0.01817 Da Error 54 predicted Formulas 10 ppm = 0.00181 Da Error 6 predicted Formulas 1 ppm = 0.00018 Da Error 1 predicted Formula C6H12O6
All-in-One-Extraction Procedure combined with isotope labelling Derivatisation (prim. Metabolites) GC-MS Analysis 13CO2 20% neg. mode Aequous phase UPLC (C18) -MS (sec. Metabolites) 80% pos. mode MeOH:MTBE:H2O neg. mode Organic phase UPLC (C8) -MS (Lipids) pos. mode 15N Ammonium nitrate Thermo Exactive (Orbitrap) plant tissue
Isotope labeling — Annotation 15N Labelled Sample 12C Labelled Sample 13C Labelled Sample m/z 756.55457 235 hits C42H84ON2P4 C42H84O3N2P2S C42H79O8NP C42H74O3N7S C42H72O6N6 C42H84O3P2S2 C42H82O2N3S3 C42H80O5N2S2 8 hits C42 1 hit C42H79O8NP N1
Metabolic Profiling • allows a rapid and simple discrimination between genotypes, developmental and environmental stages ( fingerprinting) • allows functional analysis of genes with respect to their influence on metabolic composition • is an indispensible level in systems approaches • allows identification of biomarkers
DNA RNA Protein Metabolite Complex phenotype Genomics Proteomics Metabolomics Transcriptomics
Why (Metabol)Omics? • Growth and performance of any biological system are to a large extent (if not totally) driven by its metabolic activity • Metabolites are the last level of the realization of genetic information • This level is most near to the complex phenotype ( in a linear thinking which is of course not correct)
Why (Metabol)Omics? • Biosynthesis (and degradation) of metabolites is characterized by multiple chemical transformations • A + B -> C + D • This means that metabolism by principle represents a network
Why (Metabol)Omics? • Most phenotypes are due to both linear and epistatic contributions • Genetic markers at first approximation can only represent linear contributions • Metabolites due to their inherent network characteristic represent the action and interaction of many gene products • They should thus have the potential to mirror also epistatic interactions
Metabolomics and Diagnostics • Prediction of plant biomass • Discrimination of cancer vs non-cancer tissues • Patient categorization (personalized medicine) • Prediction of type 2 diabetes • Metabolomics as a measure in wine production
Biomass prediction of field grown corn plants • 300 corn inbred lines representing 3 maturity groups were grown on two field sites • Leaves from 10 plants of each genotype and plot were harvested four weeks after germination ( leaf size : approx. 5 cm) • Metabolic profiles were run for each genotype • Biomass and flowering time were modeled using the metabolite data following a random forest approach
Metabolic profiles have a high diagnostic power for complex traitssuch as flowering time and early and late biomass
Division of the entire data set into a training set and a test set allows the prediction of biomass
Metabolomics and Diagnostics • Prediction of plant biomass • Discrimination of cancer vs non-cancer tissues • Patient categorization (personalized medicine) • Prediction of type 2 diabetes • Metabolomics as a measure in wine production
Metabolic profiling allows assigment of normal and clear cell kidney carcinoma
Metabolic Signature in CSF of Depressive Patients Accurately Predicts Antidepressant Treatment ResponseTanja Gärtner, Joachim Selbig, Abdelhalim Larhlimi, Patrick Giavalisco, Gareth Catchpole, Christian Namendorf, Lothar Willmitzer, Manfred Uhr, Florian Holsboer • Classification performance in strict cross validation • Accuracy 88 % • Sensitivity 82 % • Specificity 93 % • False-discovery rate 8 %
Predicting Fasting Plasma Glucose Level Developmentusing Human Metabolic ProfilesManuela Hische, Abdelhalim Larhlimi, Gareth S Catchpole, Andreas FH Pfeiffer, LotharWillmitzer, Joachim Selbig & Joachim Spranger Charite Berlin, Berlin, University of Potsdam, Max-Planck-Institute for Molecular Plant Physiology, Potsdam, German Institute of Human Nutrition, Potsdam Results of Classification: Established risk markers are: gender, waist circumference, BMI, age and baseline fasting glucose levels. Variables Specificity Sensitivity Accuracy Metabolites 0.70 0.67 0.68 Established markers 0.56 0.50 0.53 Metabolites + Established markers 0.70 0.67 0.68
Metabolomics and Diagnostics • Prediction of plant biomass • Discrimination of cancer vs non-cancer tissues • Patient categorization (personalized medicine) • Prediction of type 2 diabetes • Metabolomics as a measure in wine production
The wine market is highly fragmented with respect to quality criteria and assurance This leads to uncertainty concerning quality, origin, year and variety (authenticity) The problem is rooted in the absence of any objective technology Problems 32
Some first principles : The sum of its compounds reflects history and determines taste and quality of each wine The sum of its compounds is equivalent to its metabolic composition 33
5 The workflow UPLC/LTQ-Orbitrap Metabolic Mass spectrum Sample analysis • Data Analysis & Interpretation • Relative quantitative sample comparisons • Determine statistical significance • Identify metabolite(s) of interest Sample preparation Biomarkers Wine samples • Data Analysis & Interpretation/own system • Identification of masses • Potential BioMarkers for discrimination of wine samples 34 34
Cultivar Identification a CS CM ME SY CM ME SY CS b i i ii iii ii iii iv iv v v vi vi 35 35
Vineyard Discrimination Vineyard CT Vineyard Vasco Vineyard VSP From the same country 36 36
Vintage ( production year) discrimination Year 2004 Year 2005 Year 2006 37
Quality Discrimination LDA of Wines (Negative Mod) LDA of Wines (Positive Mod) 38 38
Metabolomics and Diagnostics • Prediction of plant biomass • Discrimination of cancer vs non-cancer tissues • Patient categorization (personalized medicine) • Prediction of type 2 diabetes • Metabolomics as a measure in wine production