Download
1 / 24
240 likes | 392 Views
Willingness to Pay for Low Probability, Low Loss Hazard Insurance . John C. Whitehead ECO 4810. Senior Seminar Department of Economics Appalachian State University March 19, 2007. 1. Motive your research.

E N D
Willingness to Pay for Low Probability, Low Loss Hazard Insurance John C. Whitehead ECO 4810. Senior Seminar Department of Economics Appalachian State University March 19, 2007
1. Motive your research • From your introduction, provide a slide that prompts you to tell a short story about the motivation of your paper • The goal is to get your readers interested in what you are doing
Evacuation Cost Insurance “Analysis of behavior and policy prescriptions would not be such a problem if low probability natural disasters had small consequences.” -- Ganderton et al. 2000, page 272.
2. Describe the previous literature • Describe what others have found • Describe how what you are doing is different • Be brief
Literature • McClelland, Schulze and Coursey (1993) • Ganderton et al. (2000) • Ozdemir (2005) • Burrus, Dumas and Graham (2005)
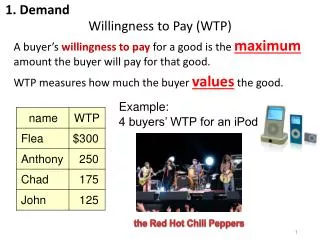
3. Theory • Present a graph (or equation) that allows you to explain the theoretical framework for your analysis
Theory Price Supply Demand (r’) Demand (r) Quantity
4. Describe your data source • Where did you get the data? • How did you manipulate it? • What is the sample size?
Data • March 2001 telephone survey • Response rate = 73% (n = 411) • Most respondents had experienced one or more hurricanes (n = 384) • 50% evacuated for at least one storm
5. Empirical Model • Present the equations so that you are prompted to (1) describe the variables, (2) introduce the empirical model
6. Describe the data/variables • Devote at least one slide to your dependent variable: (1) description, (2) summary statistics • Devote at least one slide to your primary independent variable: (1) description, (2) summary statistics, (3) the rest of your control variables can be simply listed
Dependent Variable Many people in coastal areas are safer if they evacuate their home before a hurricane strikes. But evacuating can cost a lot of time, money and lost income. Some people would rather stay at home during a hurricane so that they don’t spend money and lose income. To reduce this problem and increase safety, one plan is to have a hurricane evacuation insurance policy to reimburse people for the costs of evacuation.
Willingness to Pay • Suppose you could purchase a hurricane evacuation insurance policy from an insurance agent before the next hurricane season. The price of the evacuation insurance is $p each hurricane season. With insurance, you would be reimbursed for all of your evacuation expenses throughout the hurricane season. This would include reimbursement for travel, lodging, food, medical costs and lost income. Do you think you would purchase the hurricane evacuation insurance policy?
Independent Variables • Policy price = p (mean = $25) • Evacuation probability = r (mean = .05 ) • Evacuation cost = c (mean = $147) • Other factors affecting evacuation
6. Empirical Results • Describe your primary results. Those most interested can get the details from your paper (and remember your goal is to get members of your audience to want to read your paper). • Describe your results qualitatively (see next slide) or quantitatively (see slide after that) but not both
Willingness to Pay Models • F-stat is statistically significant • R2 = .11 • B(price) < 0 (model 1 only) • B(probability) > 0 • B(cost) > 0 • B(income) > 0 (model 2 only)
7. Conclusions • What are the (policy) implications of your research? • Interpret the magnitude of the coefficients using (1) marginal analysis, (2) elasticity, (3) consumer/producer surplus • Don’t restate your results
Summary • Each 10% increase in the probability of evacuation increases WTP by $7 • Demand elasticity = 0.64 • WTP = $34 (less than the lowest price of the insurance product)
8. Future Research • What arose during the course of the project that you’d like to fix: (1) better data, (2) missing variables, (3) a different empirical model
Future Research • An unresolved puzzle: Moral hazard • Missing variables: Subjective vs objective risk • Appropriate model: logitistic regression vs OLS