Download
1 / 27
270 likes | 432 Views
by Roberto Golinelli (University of Bologna) Giuseppe Parigi (Bank of Italy). Short-run Italian GDP forecasting and real time data. “Needed: A Real-Time Database for the Euro Area” National Bank of Belgium Brussels, June 13-14, 2005. This paper. Two basic aims

E N D
by Roberto Golinelli (University of Bologna) Giuseppe Parigi (Bank of Italy) Short-run Italian GDP forecasting and real time data “Needed: A Real-Time Database for the Euro Area” National Bank of Belgium Brussels, June 13-14, 2005
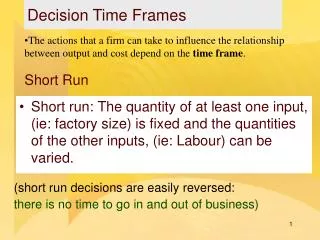
This paper Two basic aims (a) Characterise the revision process of Italian GDP data released by ISTAT (b) Analyse the effects of preliminary estimates on forecasting practice
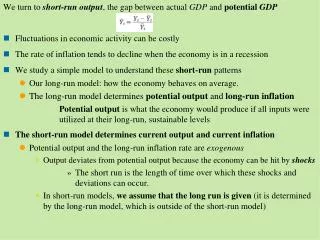
Some Definitions Vintage (yv)is the state-of-art at time T+v. Data are homogeneous and the growth rate is simply: odyvt=100(oyvt/o’yvt-1–1): “growth within” Outturn (oy)is the series with data revised for the same number of times. Data come from different vintages and the computation of growth rates needs either consistent vintage levels, or collecting odyvt. A sketch of a real-time database…
1st outturn 2nd vintage Latest available vintage
Benchmark vintages The 67th “latest available” vintage, y67, is defined as the “fully revised” GDP.
Estimation of homogeneous vintage levels REBASING oxvt = oyvt/ oyv1 and odxvt = 100(oxvt/oxv’t-1–1): “growth between” odyvt CUMULATING GROWTH-WITHIN ozvt = ozvt-1(1+odyvt/100)(from ozvT+1= oxvT+1) and odzvt = 100(ozvt/ozv’t-1–1) odyvt
Analysis of the data Both visual inspection and statistical analysis (see the paper) show that: • Levels however computed are non-stationary, while first differences are. Total revisions (log(ox/x67) or log(oz/z67), where ox or oz may be the first, the fourth or the eighth outturn, are very persistent over time. • Practical irrelevance of levels for the analysis of the GDP growth patterns. • The latest available vintageis not related to any other levels: benchmark revisions often embody greater changes with only a mild relationship with earlier released levels.
Revisions and Forecasting (1) How good are one-quarter ahead GDP forecasts in real-time, and what models are the best performers? (2) Do preliminary GDP growth releases forecast-encompass model-based predictions?
The real-time forecasting framework Three basic ingredients: (1) a real time data-set, to recreate the data availability at any given date in the past; (2)alternative models, from simple to more complex specifications; (3)behavioural assumptions about the real-time model building activity.
(1) The Italian real-time data set Vintages only for GDP and IPI, from 1988 Q2 to 2004 Q4. Indicators (financial and survey data; raw materials prices) are not revised and are chosen according to their reliability and timeliness. They are grouped into 3subsets according to the indicators starting date: I1 1970, 1972 I2 1974, 1978 I3 1980 N=16 N=10 N=11
(2) Alternative forecasting models Random walk (RW), no specification search ARIMA, the specification is obtained withunit root pretest + Hannan&Rissanen Leading Indicators (LI), GDP dynamics + only past information of indicators Bridge Models (BM), GDP dynamics + past and present information of indicators. For LI and BM we need to model the specification search in real-time…
(3) Behavioural assumptions Automatic model selection:PcGets a) The initial list of the regressorsin the GUM: changes in every sub-period (only few indicators pass to the following). b) The reduction strategy, “conservative”: minimising the risk of including irrelevant regressors. c) The GUM parameterisations: A ( for trending variables, levels for rates); B (ECM specification); C (all differences); D (pooling of the final specifications for A, B and C). d) Lag length and deterministic components: 4 lags for A, C, 3 lags for B; constant and trend (when appropriate). Lower bound: no forecasting art!
2 univariate 8 multivariate Estimation RW ARIMA LIA, LIB, LIC, LID BMA, BMB, BMC, BMD OLS rolling, 53 samples of 80 observations: first: 71Q2-91Q1 last: 84Q3-04Q2 530 estimated equations... … and standard errors of the regression ….
Our automatic modeller makes a good job Parameterisation D does it better Parameterisation C does it worse In-sample fitting
Out-of-sample Analysis Significant in-sample evidence of predictability does not guarantee significant out-of-sample predictability Danger! Spurious GDP predictability due to overfitting or data-mining. Out-of-sample analysis 530 one-quarter ahead forecasts are used to assess and compare model ability to predict both the first outturn and the “actual” GDP growth rate.
Forecasting the first outturn • Short-run indicators relevance, mainly coincident • Leading indicators ability is downsized with respect to in-sample results • Results are robust in the three sub-periods (not reported)
Forecasting Actual GDP Two definitions of “actual” (fully revised) GDP. (1) An intermediate outturn chosen as the latest vintage published before the occurrence of a benchmark change. The revisions are due only to statistical changes; (2)The latest available vintage: the revisions are due to both statistical and definitional changes. The first outturn can be seen as an alternative forecast of actual GDP and is used as a benchmark in the following tables.
“Actual” as the intermediate outturn • 1st outturn and coincident indicators (in BM) are not significantly different in predicting statistical changes. • Again, short-run indicators relevance (mainly coincident). • Again, and more than before, past&leading lose the race.
“Actual” as the latest available vintage • Ratios improve mainly because 1st outturn RMSE worsen (from 0.33 to 0.44 in this case). • 1st outturn and coincident indicators (in BM) are not significantly different in predicting statistical changes. • Again, short-run indicators relevance (mainly coincident).
NO YES Are BM forecasts encompassed by the first outturn? They contain useful information to improve the forecasting performance and should not be ignored. They can be ignored, as soon as the first GDP outturn is released (as practitioners usually do). Fair and Shiller test log(actualGDPt) = + log(1stoutturnGDPt) + log(model-basedGDPt) + ut
No useful information here BM & 1st outturn combination Either combination or BM forecast encompassing Forecast Encompassing Results - 1
Forecast Encompassing Results - 2 First outturn data always encompass model forecasts using only past information (ARIMA and LI). First outturn data and BM forecasts carry useful information for the prediction of the intermediate outturn. BM forecasts seems to encompass first outturn data for the prediction of the latest vintage. Better to combine the first outturn and BM forecast
Main findings • The Italian GDP revision process can be better characterised by considering growth rates instead of levels, probably because of a lack of satisfactory ways to define homogeneous GDP levels across vintages. • A first exercise suggest that bridge models based on coincident and leading indicators outperform alternative models in forecasting GDP first outturn growth rates, thus confirming in the real-time case a common result in the traditional BM literature.
By considering “actual” growth rates, BM forecasts appear to embody information that is not completely accounted for by the first GDP outturn (see Faust et al. 2005). • However Faust et al. analysis is based on a news model, without any practical suggestion on how to exploit the information set. This is exactly the contribution of our forecast encompassing test results. • The ex-ante nature of our analysis has useful practical implications for the researchers, for instance when initial conditions of a forecasting exercise have to be established (see Busetti, 2001).
Only x-sequential revisions are often stationary z-sequential revisions are never stationary Total revisions are never stationary Univariate DF-GLS tests
x67 not in the l.r. and exogenous (1, -1) sequential cointegration and 8x forcing variable No level-relationship (z-revisions are never stationary) Again, x67 (and z-levels) not in the l.r. and in the short-run their changes have nothing to do with levels Johansen cointegration and outturns