Download
1 / 19
190 likes | 483 Views
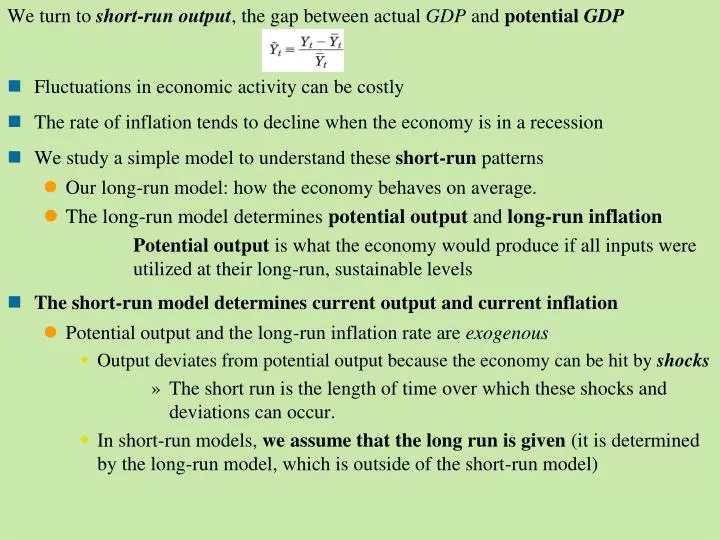
We turn to short-run output , the gap between actual GDP and potential GDP Fluctuations in economic activity can be costly The rate of inflation tends to decline when the economy is in a recession We study a simple model to understand these short-run patterns

E N D
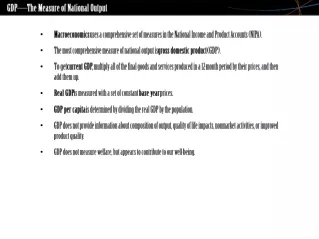
We turn to short-run output, the gap between actual GDP and potential GDP • Fluctuations in economic activity can be costly • The rate of inflation tends to decline when the economy is in a recession • We study a simple model to understand these short-run patterns • Our long-run model: how the economy behaves on average. • The long-run model determines potential output and long-run inflation Potential output is what the economy would produce if all inputs were utilized at their long-run, sustainable levels • The short-run model determines current output and current inflation • Potential output and the long-run inflation rate are exogenous • Output deviates from potential output because the economy can be hit by shocks • The short run is the length of time over which these shocks and deviations can occur. • In short-run models, we assume that the long run is given (it is determined by the long-run model, which is outside of the short-run model)
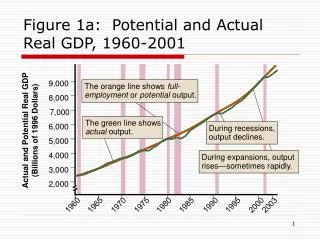
Trends and Fluctuations • Output is equal to the long-run trend plus short-run fluctuations: • the long-run trend is potential output • short-run fluctuations are percent deviations from potential GDP • A short-run fluctuation is the difference between actual and potential output, expressed as a percentage of potential output • this short-run deviation, , is called detrended output or short-run output • Fluctuations in U.S. GDP are relatively hard to see when graphed over a long period • The Great Depression was the large negative gap of the 1930s: output was well below potential • A recession begins when actual output falls below potentialshort-run output becomes negative • The Great Recession began December 2007. • A recession is over when short-run output starts to rise and become less negative • The Great Recession “ended” June 2009
since 1950, fluctuations in real GDP have mostly been between plus or minus four percent • Real GDP was 7¼ below potential in 2009III • Real GDP was 5+% below potential in 2010IV • during a recession, output is usually below potential for approximately two years, which results in a loss of about $2,400 per person • Output is still below potential after three years since the Great Recession began • during a recession, between 1.5 million and 3 million jobs are lost • Compared to the employment trend of the 2000s, over 10 million jobs were lost in the Great Recession • Thru January 2011, the number is 11.4 mil • the costs of short-term fluctuations are much less than these numbers suggest because they do not incorporate the benefits of a boom • The benefits of the construction boom are evident on the Las Vegas skyline Estimating Potential Output • assume a perfectly smooth trend passes through movements of real GDP • take averages of the surrounding actual GDP numbers • consult a variety of indicators
The Great Moderation: 1 9 8 3 -- 2 0 0 7 • the rate of inflation typically peaks at the start of a recession and then falls during the recession
The Short-Run Model • the short-run model features an open economy: • booms and recessions in the rest of the world impact the economy at home • the economy exhibits long-run growth and fluctuations • the central bank manages monetary policy to smooth fluctuations The short-run model is based on three premises: 1. the economy is constantly hit by economic shocks: • changes in oil prices, technologies, spending, or disasters that cause fluctuations in output or inflation 2. monetary and fiscal policies affect output: • policymakers may be able to neutralize shocks to the economy 3. there is a dynamic trade-off between output and inflation: • the government does not want to keep actual GDP as high as possible because a booming economy leads to an increase in the inflation rate • if inflation is high, a recession is usually required to lower it • the Phillips curve is the dynamic trade-off between output and inflation
The Phillips Curve: a boom increases inflation and a recession decreases inflation A positive relationship between the change in inflation and short-run output • Demand and output up Employment up Unemployment down Wages up faster • Costs up faster Prices up faster
Phillips Curve as Inflation-Unemployment Tradeoff Circa 1960
1970s Stagflation: Why did the Phillips curve vanish?Is there no inflation – unemployment tradeoff?
Inflation & Expectations: Natural rate hypothesis • 1970-1998: t – t-1 = 6.5% – 1.0ut = -1 (ut - 6.5%) NAIRU: Non-accelerating inflation rate of unemployment
empirically, the slope of the relationship between the change in inflation and short-run output is approximately one-half • if output exceeds potential by 2 percent, the inflation rate increases 1 percentage point • a booming economy the inflation rate increases • a slumping economy the inflation rate falls
Okun’sLaw: Output and Unemployment • In recession: output low and unemployment high • Cyclical unemployment: the difference between current unemployment and the natural rate of unemployment • natural rate of unemployment: the rate of unemployment that prevails in the long run • plotting data for cyclical unemployment and short-run output yields Okun’s law: • the difference between the unemployment rate and the natural rate of unemployment is equal to negative one-half times short-run output the unemployment rate the natural rate of unemployment
9.5 Filling in the Details • the IS curve says that an economy’s output in the short run depends negatively on the real interest rate • the MP curve shows how monetary policy affects the real interest rate
Summary 1. The long-run model determines potential output and the long-run rate of inflation. The short-run model determines current output and current inflation. 2. In any given year, output consists of two components: the long-run component associated with potential output , and a short-run component associated with economic fluctuations . The latter component is called short-run output and is a key variable in our short-run model. CHAPTER 9 An Introduction to the Short Run
3. Another way of viewing is that it is the percentage difference between actual and potential output. It’s positive when the economy is booming, and negative when the economy is slumping. A recession is a period when actual output falls below potential, so that short-run output becomes negative. 4. In the slump associated with a recession, the cumulative loss in output is typically about 6 percent of GDP – about $2,400 per person or $10,000 per family of four. The gains from eliminating fluctuations in short-run output are smaller than this, however, because of the benefits associated with a booming economy. CHAPTER 9 An Introduction to the Short Run
5. An important stylized fact of economic fluctuations is that the inflation rate usually falls during a recession. This fact lies at the heart of our short-run model in the form of the Phillips curve. The Phillips curve captures the dynamic trade-off between output and inflation: a booming economy leads to a rising inflation rate, and a slumping economy to a declining inflation rate. CHAPTER 9 An Introduction to the Short Run
6. The essence of the short-run model is that the economy is hit with shocks, which policymakers may be able to mitigate, and inflation evolved according to the Phillips curve. Policymakers use monetary and fiscal policy in an effort to stabilize output and keep inflation low and steady. This task is made difficult by the fact that potential output is not readily observed, and the economy is always being hit by new shocks whose effects are not immediately obvious. CHAPTER 9 An Introduction to the Short Run
7. Okun’s law, which allows us to go back and forth between short-run output and the unemployment rate, says that a one percentage point decline in output below potential corresponds to a half percentage point increase in the unemployment rate. CHAPTER 9 An Introduction to the Short Run