Download
1 / 16
160 likes | 318 Views
Gene Clustering Using Self-Organizing Maps and Particle Swarm Optimization. R. Earl Lewis, Jr. CMSC 838 Presentation. Talk Overview. Gene Clustering Using Self-Organizing Maps and Particle Swarm Optimization Authors: Xiang Xiao, Ernst Dow, Russell Eberhart,

E N D
Gene Clustering Using Self-Organizing Maps and Particle Swarm Optimization R. Earl Lewis, Jr. CMSC 838 Presentation
Talk Overview • Gene Clustering Using Self-Organizing Maps and Particle Swarm Optimization • Authors: Xiang Xiao, Ernst Dow, Russell Eberhart, Zina Miled, Robert Oppelt • Overview of talk • Motivation • Techniques • Evaluation • Related Work • Observations CMSC 838T – Presentation
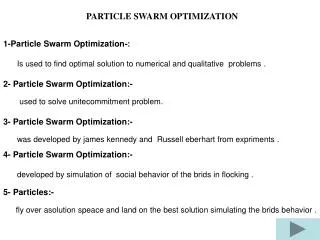
Motivation • Problem paper is trying to solve • Produce Better Clustering of Gene Datasets • Determine if Unsupervised Learning Using Neural Network Self-Organizing Map (SOM) Algorithm Produces Better Results When Used With Particle Swarm Optimization (PSO) • Verify Value of Using Conscience Factors with SOM • Confirm Benefit of Parallel Implementation of Resampling CMSC 838T – Presentation
Motivation • Why do we care • Gene Clustering Computational Intelligence Methods are Essential to the Analysis of Gene Expression Data • Use of Conscience Factor Could Reduce the Epochs and Produce a More Robust Solution • The Parallel Implementation of Resampling May Improve Execution Times and Allow Robustness to be Evaluated for Larger Data Sets and an Increased Number of Patterns CMSC 838T – Presentation
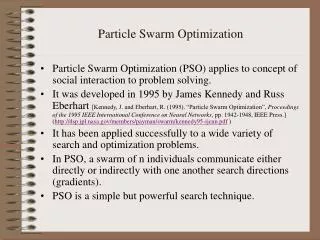
Techniques • Approach Defined Techniques to Be Studied >SOM: high dimensional datasets projected to one/two dimensional space. Unsupervised learning process. >Particle Swarm Optimization: evolutionary computational method. Update current solution using information obtained for entire population of solutions. >Conscience: trying to obtain a better approximation of the pattern of distribution in the dataset. Assigns each output neuron a bias so each component has the same chance to win. >Resampling: Measures robustness of clustering result using 60% of original data. Measure mean MERIT (lower is better) after resampling 20 to 100 times. Main Intuition Behind Approach Particle Swarm Optimization had not been used to cluster gene expression data in the past. How will results stack up to other clustering algorithms such as hierarchical, principle component analysis, genetic algorithms, and artificial neural networks. CMSC 838T – Presentation
Techniques • Algorithm > SELF-ORGANIZING MAP (SOM) -Neural Networks are computer programs designed to recognize patterns and learn like the human brain. Used for prediction and classification. Iteratively determine best weights. (input/hidden/output layers) -SOMs developed by Teuvo Kohonen in early 1980s -Colors used to indicate clusters. -Software: Viscovery, SOM_PAK (public domain) CMSC 838T – Presentation
Techniques • Algorithm > PARTICLE SWARM OPTIMIZATION (PSO) -PSOs are an evolutionary computation method. Trying to find an optimal or near optimal solution. Each particle has set of attributes: current velocity and position, best position discovered by particle and neighbors. Randomly initialized velocity and position. Updated using: Vi,n(t+1)=w*Vi,n(t) +c1*(Gi(t)-Xi,n(t)) +c2*(li,n(t)-Xi,n(t)) Xi,n(t+1) = Xi,n(t) + Vi,n(t +1) Where w is the inertia weight, c1 & c2 are random numbers, and Gi is the best particle found so far within the neighbors and li,n is the best position discovered so far by the corresponding particle. CMSC 838T – Presentation
Techniques • Algorithm > CONSCIENCE -Conscience directs each component that takes part in competitive learning toward having the same probability to win. Conscience is added to SOM by assigning each output neuron a bias. The output neuron must overcome its own bias to win. The objective is to obtain a better approx. of pattern distrib. An intermediary parameter, Yi is calculated for the ith output neuron as follows: Yi = 1 : ith output neuron is the winner, 0 : ith output neuron is not the winner Then the bias factor Pi and the final biases Bi are calculated: Pi(new) = Pi(old) + B(Yi – Pi(old)) and Bi = C(1/N – Pi) Where N is the number of output neurons, and B and C are two user selected parameters. CMSC 838T – Presentation
Techniques • Algorithm > RESAMPLING -The patterns that are in the same cluster in the original clustering should also be in the same cluster based on the clustering subset resampling. This is measured by the MERIT function. MERIT = SQRT(Sum(j)Sum(i) (Tij(u)-Tij)sqrd)/No. Patterns in selected subset) Tij(u) is and element in the original similarity matrix and Tijis an element in the resampled similarity matrix. T(ij) = 1: pattern I and j are in the same cluster, 0: pattern I and j not in same cluster. The smaller the value of MERIT the more robust the algorithm is. CMSC 838T – Presentation
Techniques • Algorithm Using Yeast Dataset (6554 gene expression profiles) & Rat Dataset(4116 gene expression profiles) • Steps of algorithm used > Stage1: weights are trained using SOM > Stage2: weights are optimized using PSO to refine clustering > Stage3: weights are trained using standalone PSO > Stage4: for each yeast and rat dataset, repeated resampling process 20 times. Avg MERIT was calculated for each cluster size >Stage 5: used MERIT analysis to select appropriate cluster size, 8 x 8 was the best choice due to robustness for size. >Stage 6: compared results of three methods >Stage 7: recalculated weights using SOM with conscience/repeated PSO >Stage 8: repeated resampling to recalculate MERIT for conscience method >Stage 9: compared results with and without conscience for three methods >Stage 10: compared SOM with other clustering methods CMSC 838T – Presentation
Evaluation • Experimental environment • Input data sets >Yeast: 6554 gene expression profiles each profile normalized to unit length so comparisons made on basic shape and relative heights >Rat: 4116 gene expression profiles same methodology as yeast • Hardware platforms Linux cluster with 1 master node and 2 slave nodes >Master Node:1 Pentium III 1.2 GHz with 1024 Mbytes RAM >Slave Node: each had 2 Pentium III 1.2 GHz and 1024 Mbytes RAM > Resampling: Parallel virtual machine environment • Software environment > SOM, PSO CMSC 838T – Presentation
Evaluation • Evaluation results • Performance of techniques >For the Rat Dataset, the SOM and SOM/PSO Clustering Results Were Essentially the Same >For the Yeast Dataset SOM/PSO Produced Better Clustering Results. See Table Below. Method Cluster No. Size of Cluster Number of Matches SOM 56 39 7 64 43 33 PSO 36 6551 40 SOM/PSO 8 30 30 16 32 10 CMSC 838T – Presentation
Evaluation • Evaluation results • Performance of techniques >For the Rat and Yeast Dataset, the SOM and SOM w/Conscience algorithm were compared >For both datasets, conscience reduced the number of epochs See Table Below. Data Set SOM w/o Conscience SOM w/ Conscience Rat 540 150 Yeast 450 220 CMSC 838T – Presentation
Evaluation • Evaluation results • Performance of techniques >For the Rat and Yeast Dataset, the SOM and SOM/PSO w/Conscience algorithm showed improved MERIT. >For both datasets, conscience and the parallel implementation reduced execution time and improved robustness as measured by MERIT during resampling. See Table Below. Data Set SOM w/o Conscience SOM w/ Conscience SOM SOM/PSO SOM SOM/PSO Rat 0.000808 0.000912 0.000535 0.000544 Yeast 0.000717 0.000752 0.000548 0.000566 CMSC 838T – Presentation
Related Work • Similar / previous approaches • The authors compared the SOM approach with other techniques based on a referenced study using 252 data sets. • SOM outperformed hierarchical clustering for 191 data sets by having higher accuracy and being more robust. • Hierarchical clustering algorithms produce a hierarchy of nested clusterings. It starts with one cluster containing all items and then splits. • THE authors used a second reference study to compare SOM with k-means, partitioning around medroids, etc… They produced similar results. CMSC 838T – Presentation
Observations • Your observations • SOM is useful but the usefulness of the technique in combination with PSO is questionable based on the results of this analysis. The MERIT for SOM/PSO was not better than SOM alone. • The use of Conscience is valuable as a competitive learning technique that reduces the number of epochs necessary to produce a robust solution. Allows larger data set to be analyzed. • The authors did not do a good job of comparing the results documented in the paper with other techniques. They just referenced other papers. These papers conducted more generic comparisons. • Statement Made Concerning SOM comparisons in referenced article: “ Since the number of outputs was limited to the number of known clusters, and linear topology was chosen, the conscience probably would not have been useful.” An example of weak analysis. • The use of SOM with PSO produced no significant improvement over the previous work . • The technique could be improved and the analysis may be more convincing if they significantly increased the number of data sets they compared against each process. The article they referenced ran comparisons and made hypothesizes based on 252 data sets compared to 2 for this articles analysis. CMSC 838T – Presentation