Download
1 / 8
80 likes | 203 Views
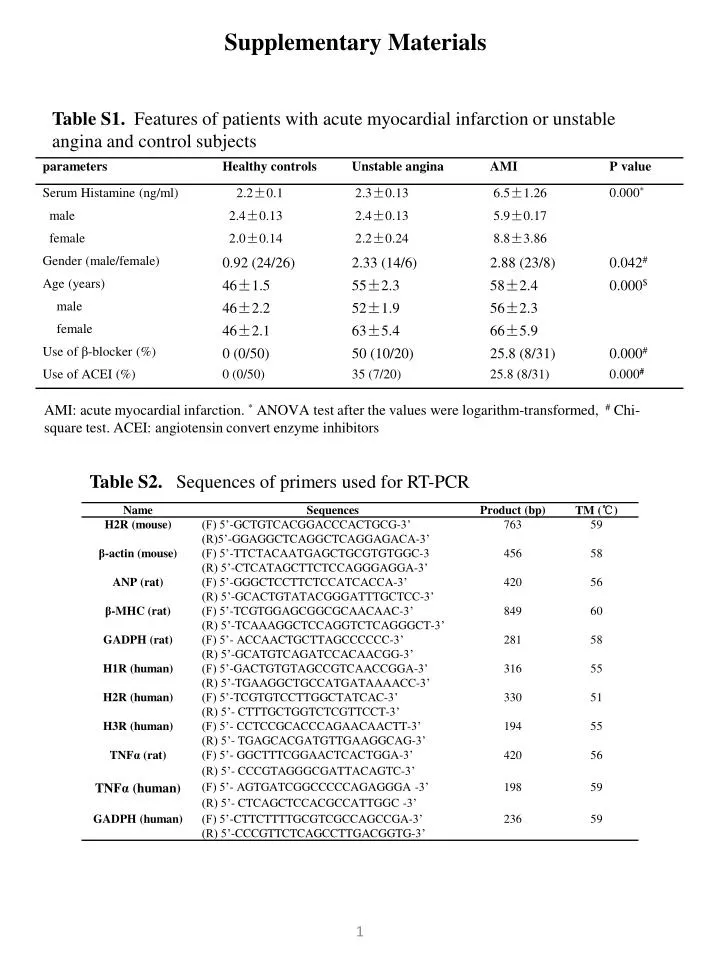
Supplementary Materials. Table S1. Features of patients with acute myocardial infarction or unstable angina and control subjects. AMI: acute myocardial infarction. * ANOVA test after the values were logarithm-transformed, # Chi-square test. ACEI: angiotensin convert enzyme inhibitors.

E N D
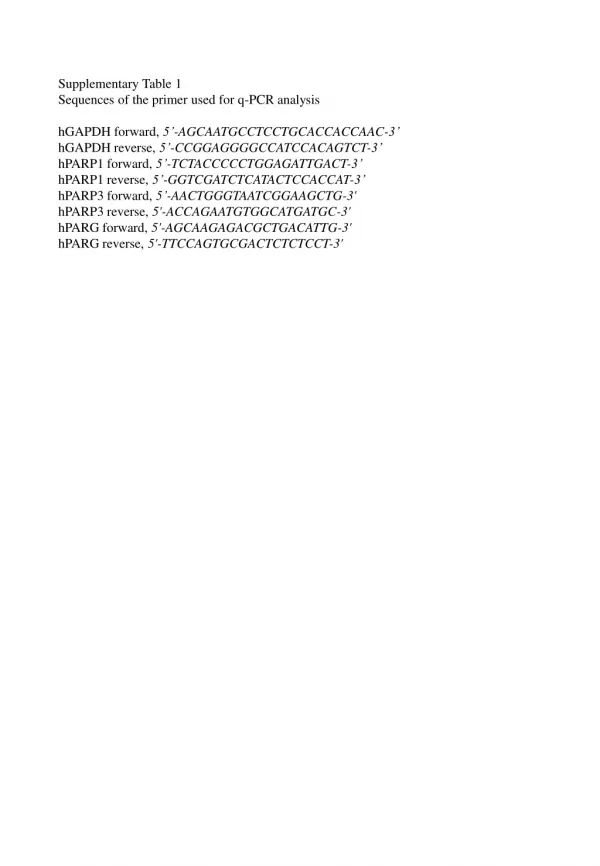
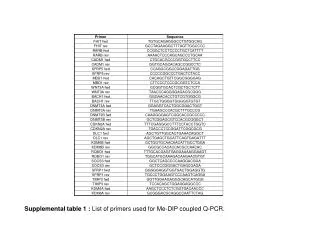
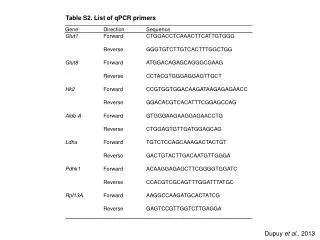
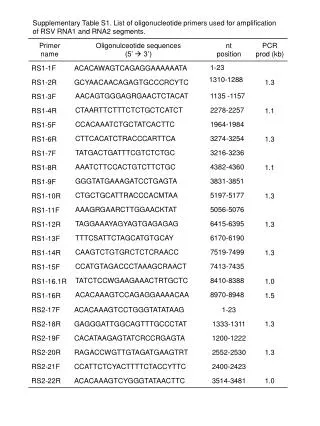
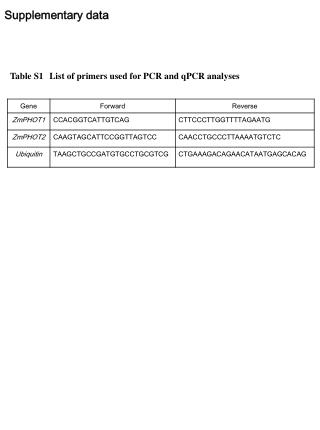
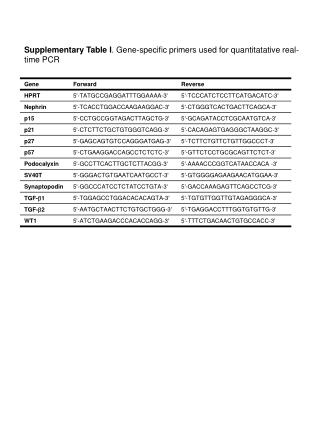
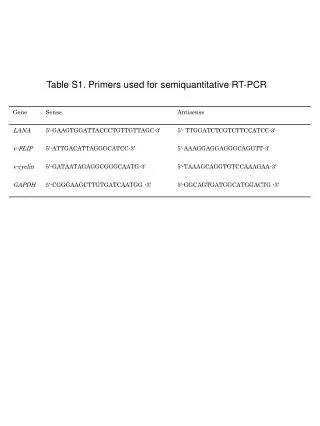
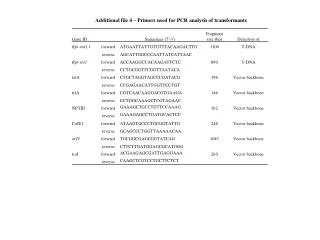
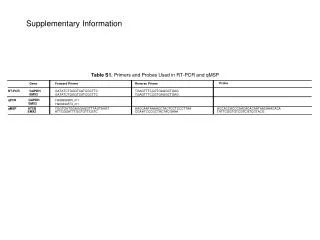
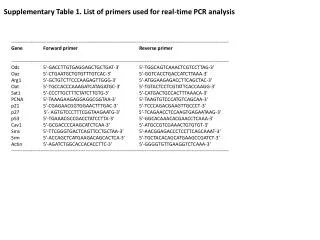
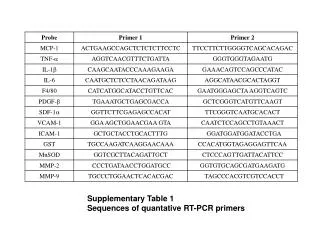
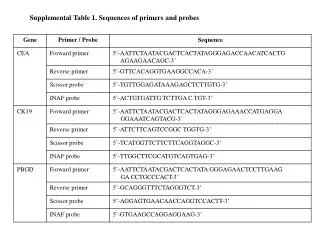
Supplementary Materials Table S1. Features of patients with acute myocardial infarction or unstable angina and control subjects AMI: acute myocardial infarction. * ANOVA test after the values were logarithm-transformed, # Chi-square test. ACEI: angiotensin convert enzyme inhibitors Table S2. Sequences of primers used for RT-PCR 1
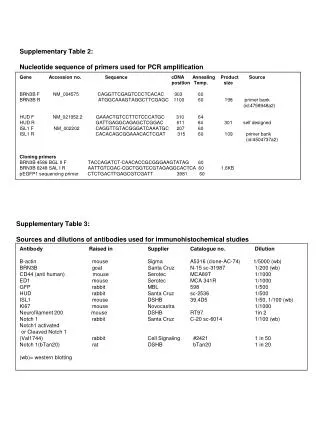
Front Rear Table S3. Correlations between logarithm of serum histamine and other factors right auricle left auricle right auricle Normal state Normal state Female=1, male=2; AMI=1, unstable angina=2, healthy controls=3; use of β-blocker=1, non-use of β-blocker=0; use of ACEI=1, non-use of ACEI=0 Immediately after LCA ligation Left side Right side 45 mins after LCA ligation B Immediately after LCA ligation A right auricle left auricle WT HO HE Immediately after LCA reperfusion 24 hours after LCA ligation 1000 bp C 298 bp 1 hour after LCA reperfusion 24 hours after LCA reperfusion D Figure S1. Genotyping and confirmation of myocardial infarction model in mice. (A) Genotyping of H2R knockout mice using PCR. (B) Whole view of heart for slice cutting after Evans blue injection. (C) Serial confirmation of ECG changes in response to ischemia for 45 min and reperfusion for 24 h. (D) Serial confirmation of ECG changes in response to ischemia for 24 h. 2
0 0.01 0.1 Histamine (μM) Figure S2. Representative pictures of Hoechst stained neonatal rat cardiomyocytes (panoptic cells were indicated by bright blue) exposed to different concentrations of histamine. Scale bar = 100 m. 1 10 100 3
p-moesin moesin β-actin Concentrations of histamine (μM) D A 0 0.1 1 10 p-ERK/ERK p-ERK ERK Control AD His Ratio of p-moesin/moesin Concentrations of histamine (μM) B His+10 μM U0126 10 0 0.1 1 C His 0.5h 24h p-ERK ERK Control AD His Control AD His Bax Figure S3. Effects of H2R activation on activities of moesin and ERK as well as Bax translocation in neonatal rat cardiomyocytes.(A) Both amthamine dihydrobromide (AD, a selective H2R agonist) and histamine (His) increased mitochondrial translocation of Bax. (B) Both AD and His increased the phosphorylation of ERK. (C) MEK inhibitor U0126 exerted a persistent inhibitory effect on the phosphorylation of ERK (Cont: control without using U0126). (D) Histamine exerted no influence on the phosphorylation of moesin. # p < 0.01 vs. the control, n = 3-5 in each group. Doses of histamine and AD in panel A-C were 1 μM. Cox-Ⅳ # # # Bax/COX-IV # 4 Control AD His
A † † † † † † † † † # # # # # # # # † † † B # # # Start of drug treatment # Hypoxia Reoxygenation Figure S4. Influence of histamine on endothelial permeability. (A) Effect of histamine receptor H1 antagonist on the dynamic changes of transmembrane resistance (TMR) in cultured HUVECs in response to stimulation of histamine (1 M) . # p<0.01 vs. control; † p<0.01 vs. histamine; n=20 in the control group and n=4 in other groups. (B). HUVECs were treated with famotidine (1 M) or diphenhydramine hydrochloride (1 M) to block the H2R and H1R, respectively. # p<0.01 vs. control; † p<0.01 vs. histamine or reoxygenation; n=20 in the control group and n=4 in other groups. 5
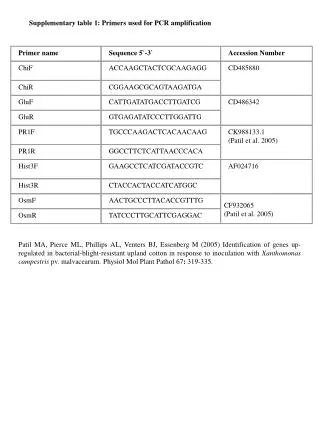
B A H1 H2 H3 H4 His+10μM U0126 Receptors His 0.5h 24h GAPDH p-ERK Control His ERK p-ERK * C * p-ERK/ERK ERK Control AD Fam Fam+AD D E * * * * p-moesin/moesin † AGEs His Control Control AD His Control AD p-moesin/moesin p-moesin p-moesin moesin moesin p-ERK ERK p-moesin Control AD Fam Fam+AD moesin Figure S5. Effects of H2R activation on activities of moesin and ERK in HUVECs. (A) mRNA expression of histamine receptors. (B) Both amthamine dihydrobromide (AD, a selective H2R agonist) and histamine (His) increased the phosphorylation of ERK. (C) MEK inhibitor U0126 exerted a persistent inhibitory effect on the phosphorylation of ERK. (D) AGEs (advanced glycation end products), His and AD increased the phosphorylation of moesin. (E) Famotidine (Fam) abrogated the AD-induced phosphorylation of moesin. * p < 0.05 vs. the control, †p < 0.05 vs. AD. n = 3-5 in each group. Doses of histamine, AD, famotidine and AGEs were 1 μM. 6
HE Figure S6. Immunohistochemical detection of myocardial myeloperoxidase (MPO) and caspase 3. In response to 24 ischemia in a wildtype (WT) mouse, example views of HE, MPO and caspase 3 stain under different magnifications. Ischemia 24 h Anti-MPO Anti-caspase 3 7
A WT-Sham WT-IR WT-IR+AD Ischemia 45min/Reperfusion 24 h KO-IR WT-IR+Fam WT-IR+Fam+AD 100 μm B WT-Sham WT-IR WT-IR+AD Ischemia 45min/Reperfusion 24 h KO-IR WT-IR+Fam WT-IR+Fam+AD Figure S7. Immunohistochemical Detection of Myocardial Myeloperoxidase (MPO) and Caspase 3 in Mice in response to 45 min of ischemia/24 h of reperfusion .(A) Representative MPO. (B) Representative caspae-3 staining . WT, wild-type mice; KO, H2R knockout mice; MI, myocardial infarction; AD, amthamine dihydrobromide; Fam, famotidine. 8