Download
1 / 46
470 likes | 673 Views
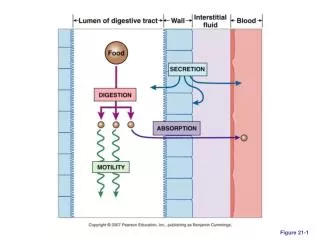
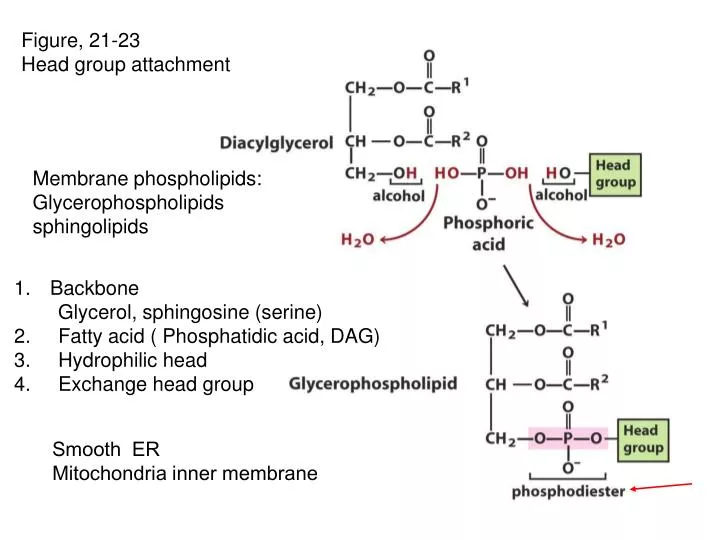
Figure, 21-23 Head group attachment. Membrane phospholipids: Glycerophospholipids sphingolipids. Backbone Glycerol, sphingosine (serine) 2. Fatty acid ( Phosphatidic acid, DAG) 3. Hydrophilic head 4. Exchange head group. Smooth ER Mitochondria inner membrane.

E N D
Figure, 21-23 Head group attachment Membrane phospholipids: Glycerophospholipids sphingolipids • Backbone • Glycerol, sphingosine(serine) • 2. Fatty acid ( Phosphatidic acid, DAG) • 3. Hydrophilic head • 4. Exchange head group Smooth ER Mitochondria inner membrane
Figure, 21-24 Two strategies for forming phosphodiester bond
FIGURE 21–25 Origin of the polar head groups of phospholipids in E. coli. p.826
Figure, 21-26 Polar head in eukaryotes Kinase-- Signal transduction Mitochondria inner membrane Help enzymes for energy metabolism --complex IV and V, apoptosis (cytochrome C release)
Figure, 21-27 Yeast (Eukaryotic cells –major source of PE and PC) PS PE p.828
Figure, 21-27 S-adenosylmethionine (SAM) S-adenosylhomocysteine PC p.828
Figure, 21-28 b Phosphatidylcholine in mammals PE (the same strategy) Salvage pathway Choline reused (strategy 2)
Figure, 21-29 summary of the pathways for synthesis of major phospholipid Mutation in ethanolamine kinase (easily shocked) Eliminate phosphatidylethanolamine Synthesis: less in membrane Transient paralysis: electrical stimulation In liver only In mammals (no CDP-diacylglycerol and serine to PS) p.829
Figure, 21-30 Ether lipid, Plasmalogen platelet-activating factor Half of the heart phospholipid
Figure, 21-31 Sphingolipids 2nd big group Lung surfactant
O- Step 1 18 C amine
Step 2 (SER) Step 3 Step 4 Glycolipid Glycosidic linkage
Figure, 21-32 Not required in diet Cell membrane Steroid hormone Bile acids
Figure, 21-33 Cholesterol biosynthesis In liver condensation 6C 5C polymerization 30C cyclization
Figure, 21-34 Synthesis of mevalonate cytosol Rate-limiting step Release 3CoA (membrane of the SER)
Figure, 21-35 Mevalonate to activated isoprene Use 3 ATP Release 1 CO2
Figure, 21-36 Squalene 10C 15C 30C
Figure, 21-37 Ring closure Mixed function oxidase plants 20 steps Methyl group migration and removal
Figure, 21-38 Cholesteryl esters Stored or in lipoprotein particles
Figure 21-39 Plasma Lipoproteins- Lipid transport (LDL)
TABLE 21-1 p.836
TABLE 21-2 p.837
Figure21-40 Lipoprotein and Lipid transport apoA-I apoB100 apoE apoB100 apoCII--lipase
Figure 21-42 Uptake of cholesterol by receptor-mediated endocytosis
Figure21-40 Lipoprotein and Lipid transport apoA-I SR-BI ABC1
Figure 21-41 Chylomicron and VLDL remnants Surface of nascent HDL
Figure, 21-44 Regulation of cholesterol dp p Inhibit transcription
Figure, 21-43 SREBP (sterol regulatory element-binding protein) activation SCAP: SREBP cleavage-activating protein— binds to cholesterol and other sterols HMG CoA reductase LDLR
Figure, 21-45 Inhibitors of HMG-CoA reductase Cholestyramine-resin binds to bile acids -prevent reabsorption Competitive inhibition of HMG-CoA reductase statin
Figure, 21-48 isoprenoid Prenylation Proetins are anchored to cellular membrane
Figure, 21-46 Steroid hormones from cholesterol Increase gluconeogenesis And TAG cycle
Figure, 21-47 Side chain cleavage Adrenal cortex mitochondria Hydroxylation and cleavage
Fatty liver: • TAG formation and export imbalance • Extensive accumulation of TAG—cirrhosis • Free fatty acids increase in plasma, then to liver accumulation • Block production of plasma lipoproteins • a. apolipoprotein synthesis • b. lipoprotein • c. phospholipid • d. secretorypathway • Ethanol—fatty liver • Ethanol is converted to be acetaldehyde by alcohol dehydrogenase • and NADH is produced • Excess NADH inhibit CAC and increase lipogenesis (cholesterol)
Homework: How insulin regulates lipid metabolism?