Download
1 / 5
50 likes | 282 Views
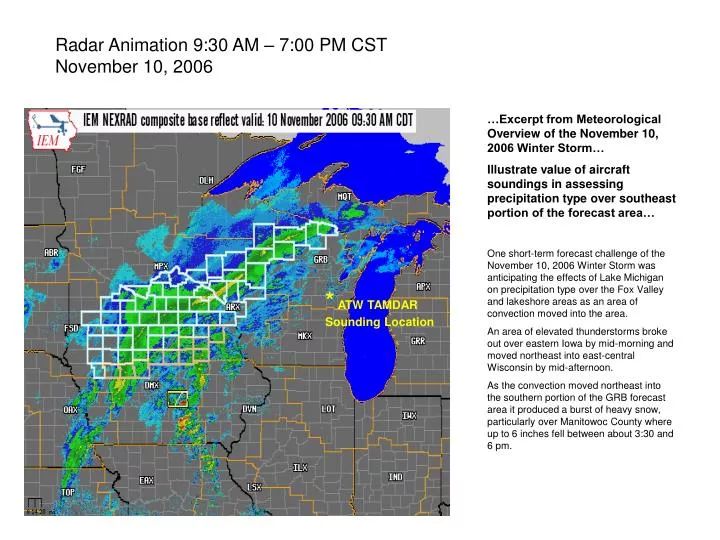
Radar Animation 9:30 AM – 7:00 PM CST November 10, 2006. …Excerpt from Meteorological Overview of the November 10, 2006 Winter Storm… Illustrate value of aircraft soundings in assessing precipitation type over southeast portion of the forecast area…

E N D
Radar Animation 9:30 AM – 7:00 PM CST November 10, 2006 …Excerpt from Meteorological Overview of the November 10, 2006 Winter Storm… Illustrate value of aircraft soundings in assessing precipitation type over southeast portion of the forecast area… One short-term forecast challenge of the November 10, 2006 Winter Storm was anticipating the effects of Lake Michigan on precipitation type over the Fox Valley and lakeshore areas as an area of convection moved into the area. An area of elevated thunderstorms broke out over eastern Iowa by mid-morning and moved northeast into east-central Wisconsin by mid-afternoon. As the convection moved northeast into the southern portion of the GRB forecast area it produced a burst of heavy snow, particularly over Manitowoc County where up to 6 inches fell between about 3:30 and 6 pm. * ATW TAMDAR Sounding Location
18 hour forecast 850 mb RH Comparison from the 18 UTC November 9, 2006 Model Cycle. Model Forecasts valid at 12 UTC November 10, 2006. The models (left) were forecasting a layer of dry air centered around 800 mb to persist over eastern Wisconsin through the morning. As suggested in the radar animation above, it appeared that at least through about mid-day, the precipitation approaching the Fox Valley / east-central portion of the forecast area had a tendency to erode as it encountered the drier air. This likely led to some evaporative cooling in the lower portion of the troposphere.
Examination of the 00Z (dashed) and 12Z (solid) GRB soundings (left) revealed the dry layer centered around 800 mb. The dry layer was still evident at 12Z. Note the substantial cooling that had taken place especially below 750 mb. Maximum warm layer temperatures were around +2 degrees C at 750 mb. Ice falling through this warm layer would likely only partially melt. A shallow surface-based warm layer was still in place at 12Z but there was still a fairly large dew point spread suggesting that additional near surface evaporation could erode the surface-based warm layer as well. 00Z and 12Z November 10, 2006 GRB RAOBS 1234Z and 1524Z ATW TAMDAR Soundings The 1234 Z ATW TAMDAR sounding (black profile in the image to the right) revealed a generally similar structure to the 12Z GRB sounding below 700 mb. However, note how the profile cooled dramatically in just 3 hours (1524 Z sounding in purple). The entire ATW sounding was below freezing except for a very shallow surface-based warm layer. There was also a rather deep isothermal layer around -3 degrees C between 900 and 800 mb. The 1524Z ATW aircraft sounding suggests that in the absence of additional WAA, the most likely precipitation type would be snow (assuming ice crystal seeding from above) However, keep in mind that the observed 8 am ground (soil) temperatures at GRB was still 43 degrees F which would have an impact on actual snowfall accumulations in the Fox Valley.
A look at the ATW TAMDAR sounding 3 hours later (1815Z sounding in black in the image below), now indicated that the sounding had become nearly saturated below 700 mb with only a very shallow surface-based warm layer. Also note the deep layer of northeasterly winds below 800 mb. Comparison to the 18Z RUC analysis sounding (purple profile in the image below) indicated that the RUC was too slow to saturate the column and too warm below 900 mb. Based on the radar animation (left), the heavier convective precipitation began to move into the Fox Valley area shortly after 3 pm. The 15Z and 18Z ATW TAMDAR soundings, suggested that the precipitation would likely be all snow (or maybe briefly start as a mix…then change over rapidly to snow). Given the convective nature of the radar echoes approaching the area, heavy precipitation would be expected. Assuming heavy doses of ice crystals would feed the lower levels as the convection moved in, the melting effect (absorption of heat from the environment to melt the ice crystals) would also contribute to cooling the remaining shallow surface-based warm layer.
17Z – 22Z Surface Plot Animation Around mid-day, surface temperatures were generally in the mid-upper 30s in the Fox Valley and lakeshore, while surface dewpoint temperatures were hovering around 30 degrees F. As expected, once the precipitation began, temperatures fell while dew points rose a few degrees. As the heavy precipitation moved into the Fox Valley by around 20Z, the precipitation briefly started as rain or a mix…but very quickly (within an hour) changed over to moderate-heavy snow. Thunder was reported generally from Green Bay southward. Also note that as the weak surface low passed to the south, surface winds also backed slightly to the north, which may have helped to diminish any boundary layer warming effects from Lake Michigan. Snowfall rates were on the order of 2-3 inches per hour as the convection moved through between about 4 and 6 pm. Although the snow accumulated mainly on grassy areas, the brief intense snowfall rates allowed slushy accumulations to occur on the roads accompanied by reduced visibilities less than a ¼ mile for a time during the rush hour. This brief example illustrates how the TAMDAR soundings helped to increase the forecasters short-term SA. In this case, the soundings were valuable in helping the forecaster anticipate the likely precipitation type as the convection moved across the southeast portion of the forecast area. - SOO KGRB