Download
1 / 33
330 likes | 422 Views
Welcome to …. Preston Lewis Science Systems and Applications Inc.

E N D
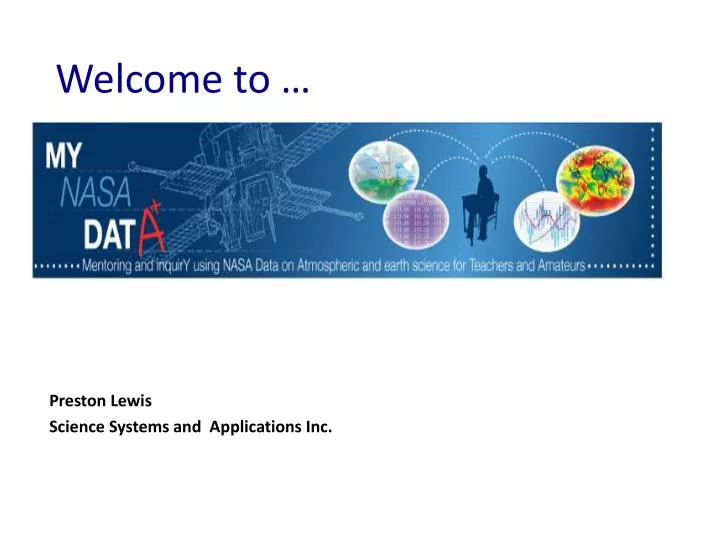
Welcome to … Preston Lewis Science Systems and Applications Inc.
MY NASA DATA is a website that was created so that anyone can utilize a huge bank of satellite data for easy use. Through the use of our Live Access Server (LAS) you are able to generate plots graphs and other images to be used as you need. With this data visualization tool you will be able to look at NASA EOS data in a new light.
MND: What Users are Saying • students graph and analyze the same data that NASA scientists might use • science more relevant and exciting • current relevant data will give students, teachers, and citizens a way to better understand our world
What NASA Studies on Earth • Atmosphere • Biosphere • Cryosphere • Land Surface • Oceans
Now lets look at Precipitation and its effects on tree rings in the lesson: “Analyzing Tree Rings to Determine Climate Change”
1 2 3
For each time series plot you generate you have the ability to look directly at the raw data. This allows you to hand plot the numbers or get a more precise view of what is going on
Tree Information Virginia Pine: PinaceaePinusvirginiana Location: Kenbridge VA Longitude: 81.2 W Latitude: 36.2N Cut Down: 2009 Age: 29 years
Items of Interest 1. Very thin dark ring? 2. Rather thick dark ring? 3. Consistent decrease in ring thickness 1997 1988
1. Very Thin Dark Ring? -Lower amounts of rainfall in the summer cause the presence of a very thin summer growth ring.
2. Rather Thick Dark Ring? -Increased rainfall during the summer months caused the dark growth ring to be larger than surrounding years.
3. Consistent Decrease in Ring Thickness 3. Consistent decrease in ring thickness How can the Live Access Server be used to show long term trends?
Long Term Trends in the LAS • In the LAS, a user option for output format is an ASCII text file. • This text file can be imported into Excel allowing the user to manipulate the data as needed.
3. Consistent Decrease in Ring Thickness -Declining rainfall coupled with increase tree size accounts for the consistent decrease in ring thickness. Rainfall in mm/day mean Year
Lets look some examples of sea surface temperature in the lesson: “Hurricanes as Heat Engines”
Questions from a lesson: Can you see the effect on the temperature in your line plot after the hurricane passed? If so is this a normal drop in temp for such a large body of water? Explain. How long did it take for the SST to return to the previous temperature?
A Side by Side Comparison September 20, 2005 September 28, 2005
Lets look some examples of Aerosols in the atmosphere: As featured in the A-Train Symposium
What Else Can The LAS Do?Let’s go take a look in the Live Access Server