Download
1 / 52
520 likes | 646 Views
Data from the front lines – What can we learn from proficiency testing and real patient data ? . AACC Annual Meeting Chicago July 22, 2009. Today’s Reality. Reactive health vs. preventive health The Internet is moving information to the patient (patient centric health care)

E N D
Data from the front lines – What can we learn from proficiency testing and real patient data ? AACC Annual Meeting Chicago July 22, 2009
Today’s Reality Reactive health vs. preventive health The Internet is moving information to the patient (patient centric health care) Evidence based Medicine Electronic medical record – merge data from multiple sources
CLIA Laboratories must establish or verify performance standards (Section 493.1253 (b)(3) ) Laboratories are required to make these same performance standards available to their clients on request (493.1291 (3)
Guide for setting quality specifications Global strategy for setting quality specifications in laboratory medicine (IUPAC, WHO, IFCC – Stockholm 1999) (1) Quality specifications based upon an assessment of the effect of analytical performance on specific clinical decisions (NCEP-ATP)
XIX International Congress of Clinical Chemistry IFCC/AACC Annual Meeting, Orlando, 2005An International study examining the “trueness” and precision of lipid measurements in 27 countries (Poster) 27 countries, 5 human serum samples, measured three times on each of 3 days Target values assigned by Reference Methods traceable to CDC Calculated within sample CV, % Bias, % TE
XIX International Congress of Clinical Chemistry IFCC/AACC Annual Meeting, Orlando, 2005An International study examining the “trueness” and precision of lipid measurements in 27 countries (Abstract)
Measurement of creatinine by clinical laboratories in British Columbia Mean TE = 23.9% Mean Bias = 16.5% (+) Mean CV = 3.02 ; SD = 2.24
Creatinine – Performance Goals Recommended Total Error allowable (TEa) performance goals for the measurement of creatinine as calculated on the basis of biological variation: Minimum 11.4 % Desirable 7.6% Optimal 3.8% ClinChem 52:5-18 (2006)
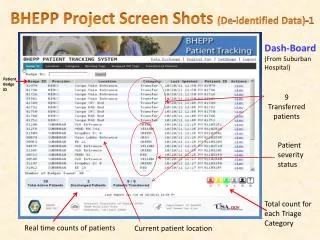
Impact of Standardization Program on Creatinine Results (RV +/- 10%) 50.4% Pass | 49.6% Fail ; 90.3% Pass | 9.7% Fail Impact on eGFR (RV +/- 10%) 58.7% Pass | 41.3% Fail; 86.6% Pass | 13.4% Fail
British Columbia Estimated 145,000 people in BC at increased risk of CKD Provincial creatinine testing system was operating with a positive 16.5% bias If adult population is uniformly tested throughout this system – 535,000 people added to the at risk category (false positive)
British Columbia Reduced mean provincial bias from 16.5% to 2.7%. Provincial TE for the measurement of creatinine was reduced from 23.9% to 8.7% At a maximum the program theoretically reduced false positives by 84% and kept 449,400 people from being “incorrectly classified” as being “at risk”. Estimated savings - $37 million J Am Soc Nephrol 19:164-169 (2008)
Guidelines – Reference Intervals • Theoretically sound – impractical in the face of reality • Defining “healthy” – a problem, small n value • No assurance that sub-clinical disease is not present • Control for pre-analytical sources of variation • Costly to do, ethics, recruitment, stratification issues (paediatrics, elderly, rare sample types) • Assumes method performance is constant • Resorting to the use of RI as published years ago
Reference Intervals - Today’s Realty • Results from different labs differ significantly • The expense of performing effective reference interval studies in all labs for all analytes is prohibitive • Assumption: differences in reference intervals between labs is due to differences in assay standardization • Assumption: differences in method standardization are allowed for in local reference intervals
Reference Intervals - Today’s Realty • Assumption: method bias over time is constant • Assumption: there is a correlation between a measured analyte concentration and its stated reference interval • Assumption: Setting reference intervals at the lab level reduces the need for strict control of bias
Instrument to instrument variation in reported creatinine given a true creatinine value of 100 umol/L (1.13 mg/dL)
Upper Limit of Creatinine Reference Interval (Adult Males)* Mean % Bias at 100 umol/L across all models
Potassium RI Results(n = 503) Range of RI Low 3.00 – 3.90 Nordic RI 3.60 – 3.63 (90% CI) Range of RI High 4.50 – 6.20 Nordic RI 4.61 – 4.66 (90% CI) Range of Upper critical limits – 5.2 to 7.0 mmol/L Range of Lower critical limits – 2.0 to 3.6 mmol/L Clin. Biochem. (2000)33:449-456 Nordic Reference Interval Project (http://www.furst.no/norip/)
Reference Intervals “We like to assume that the calibration of our methods remains constant over time obviating the need to change our reference intervals “
Variation between IDMS traceable reagent lots for measurement of creatinine
Clinical laboratories trigger 75% of medical decisions. Typically operate as islands unto themselves (peer group mean +/- 2SD) Inaccurate test results, incorrect diagnosis Variable reference intervals, critical limits, reporting comments = misinformation/wrong decisions = $$$$$ Incorrect treatments, unnecessary treatments Significant contributor to repeat testing
Message When it comes to Reference Intervals Don’t ignore reality!
Assessing serial test results Two cholesterol test results obtained 3 months apart. The first result is 6.60 mmol/L and the second result is 5.82 mmol/L. Is the observed difference between the two test results significant? Reference intervals are not of much help here. A Reference Change Value Index (RCVI) may be more helpful. “Biological Variation: from Principles to Practice” Callum G. Fraser, AACC Press (2001)
Reference Change Value (RCV) Using biological variation data we can determine whether or not the difference between these two cholesterol test results is statistically significant RCV = 21/2 + Z + (CVa2 + CVi2)1/2
Reference Change Value First value = 6.60 mmol/L Second value = 5.82 mmol/L Change as a percent of first result = 12% Lab’s CVa from IQC data = 1.6%; CVi = 6.0 RCV = 21/2 + Z + (CVa2 + CVi2)1/2 = 17.2% (p < 0.05)
RCV Index RCV index = 12/17.2 = 0.69 If the RCV index is greater than 1 – the change is significant (p<0.05). If the RCV index is less than 1 - the change is not significant Conclusion: the change in cholesterol in this patient is not statistically significant
The indirect “a posteriori” study of patient data for the generation of Reference Intervals Reference Hoffmann RG. Statistics in the practice of medicine. JAMA. 1963; 185: 864-873
Hoffman’s Method • Chauvenet’s criteria are used for the detection and elimination of outliers. A result is eliminated if the probability of its occurrence is less than 1/2N were N is the number of measurements in the data pool and is greater than 4. • Following elimination of outliers the cumulative frequency for each test result is determined
Visual examination – provides a good approximation of the linear portion of the data • Compute the maximum deviation of the data from the regression line in this interval – define the acceptable linearity error
Regression functions and reference intervals as calculated for fiveanalytes by Hoffmann’s method.
Creatinine RI (mg/dL) as calculated from patient test result data according to Hoffmann *Rustad et al. Scand J Clin Lab Invest 2004;64:271-284 *Ceriotti R et al. Clin Chem 2008; 54(3):559-566
Comparison of reference intervals as calculated by Hoffmann’s method for two sets of TSH data collected at two different points in time (8 months interval)
“when it comes to testing – medical laboratories are like boats on a lake – everyone is paddling but no one knows where the dock is”
"Perhaps we may never know where we are in the analytical universe in an absolute sense, but certainly we ought to know where we are in relation to each other" William Horwitz
The Internet Value Proposition for Clinical Laboratories • A worldwide “tool of stewardship” • An infrastructure for standardization and the harmonization of process • A vehicle for disseminating standards, guidelines and protocols • A system for real-time sharing of performance data • A system for generating meaningful Reference Intervals
Is there another way ? The power of aggregated data – an Internet Solution Peer Group Network Network Performance Data Patient Test Results Normalized Network and Laboratory Specific Reference Intervals
“The future is now – it is just hasn’t become organized yet”