Download
1 / 33
330 likes | 465 Views
TCOM 540. Session 3. Agenda. Quiz Review Session 1 homework Address real-world data issues. The Real World – Getting Data. A network design is only as good as the data that supports it Traffic data Cost data. The Real World – Getting Data (2).

E N D
TCOM 540 Session 3
Agenda • Quiz • Review Session 1 homework • Address real-world data issues
The Real World – Getting Data • A network design is only as good as the data that supports it • Traffic data • Cost data
The Real World – Getting Data (2) • Different types of information are needed and available for • Voice networks • Data networks
Voice Traffic Data • Realistically, most large users acquire voice by a Virtual Private Network (VPN) approach • This may change - e.g., VoIP • That is, user buys a service, not a network • Traffic rides on common user infrastructure of IXC • Takes advantage of economies of scale
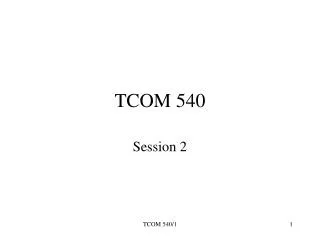
Voice VPN User Site C User Site D User Site E IXC “cloud” User Site B CO IXC POP Access lines IXC = InterExchange Carrier POP = Point of Presence CO = Central Office (Local Exchange Carrier) Offnet User Site A
Voice Traffic Data Needs • What data is needed to acquire a VPN? • Your sites (i.e., on-net locations) • Traffic matrix (i.e., point-to-point traffic file) for on-net traffic • Site-to-offnet traffic • Optionally, time-of-day profiles • Features required and usage
Voice Traffic Data Sources • Current carrier should provide Call Detail Records (CDR) • Originating #, terminating #, time of day, duration, features used, charges • CDR may require considerable manipulation to provide useful data • Format changes • Site identification • Large number of records (millions per month for a large organization)
Call Detail Records – Additional Information • http://www.cisco.com/univercd/cc/td/doc/product/voice/vpdd/cdd/3_1/cdr.htm • http://www.qwest.com/wholesale/clecs/output.html
Voice Traffic Data Sources (2) • If CDR not available, may have to estimate traffic based on site size (people) and assumed calling patterns
Voice VPN Costs • Basic price structure is usually fairly simple • Postalized CONUS on-on, on-off, and off-off rates • Off-net access (i.e., switched access) usually included • On-net access (usually dedicated not switched) is not included • May be available from carrier as pass-through from LEC tariff
Voice VPN Costs (2) • Reliable comparative price information not easily available • AT&T no longer dominant carrier • Best prices are in private contracts between carrier and customer • Carriers supposed to post tariff-equivalent information, but usually partial, obscure or missing • Private services such as Valucom, CCMI provide some tariff/contract information
Voice VPN Costs (3) • Prices very dependent upon commitment • Volume ($ or minutes) • Duration of contract • Variety of bargaining techniques are available to buyers • Subject of later session
Data Traffic Data • Data is much more complicated than voice • Different types of traffic • Email • File transfer • Database access • Web browsing • VoIP • Streaming video • Etc., etc.
Data Traffic Data (2) • Different requirements • Speed • Latency • Delay • Loss • Reliability/availability
Data Traffic Data (3) • Information often less complete and more difficult to acquire than for voice • Exact traffic for applications riding on the network may only be known to the “owner” of the application • Telecom supplier will probably only provide information needed for billing • Equipment such as routers and concentrators (e.g., Cisco MC3810) can be configured to collect traffic data, but usually aren’t …
An Example – FTS2000 • FTS2000 was a VPN that replaced the General Services Administration’s FTS network about 1990 • FTS was an on-net to on-net private line network providing long-distance voice service for non-defense agencies • FTS2000 included off-net voice, dedicated circuits, circuit switched data, and packet switched data
FTS2000 (2) • Only on-net to on-net voice data available • Very limited response to surveys of customer agencies • Projected data, off-net voice and inbound WATS requirements (i.e., 800 service) requirements as proportional to voice traffic • Constant of proportionality for 800 service was chosen as 2.5% • Wanted to have some representation, but not enough to unduly influence the selection
FTS2000 (3) • Actual 800 service traffic was much higher • Approximately equal to on-net voice • Main sources were IRS and SSA • Overall voice traffic was about three times the estimate • Because the prices declined with increasing volume, network was significantly more cost-effective than projected
Traffic Generators • The preceding example showed the use of a traffic generation algorithm • Which turned out to be not very accurate as a predictor of actual traffic … • Cahn also gives a couple of examples of real cases where traffic generators had to be used • May need to generate both traffic and costs
A Small Complete Design • 5 nodes at specific locations (V&H) • Types of links available for use (capacities) • Formula to convert bps on links to packets per second at nodes • Traffic • Link costs • Switch capabilities • Other miscellaneous data
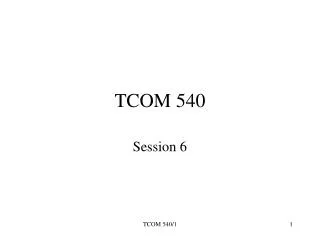
Close Up N3 N4 N1 N5 N2
Lines and Traffic • Line T1, speed = 1000000 • Traffic – each node sends 10000 to each other node • How many entries in traffic table?
Lines and Traffic • Line T1, speed = 1000000 • Traffic – each node sends 10000 to each other node • 20 entries in traffic table
Cost • Tariff information provided
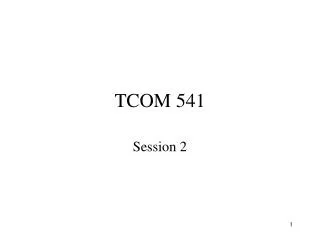
Comparison of Cost and Distance Distance Cost
Cost as a Function of Distance • We can easily discern that Cost = 1000 + 3.2*distance • Next week we’ll look at some other tariff models
Equipment • Costing site equipment is one of the more complex parts of the process in real life • Many suppliers, models, capabilities • Switches, routers, multiplexers, etc., all have different characteristics • The equipment table makes fairly gross simplifications to render the problem tractable
Equipment (2) • Example uses • Three size categories (small, medium, large) • Four speed categories (slow,medium, fast and vfast) • Plus vlargevfast, no_equip and infeasg • Equipment characteristics defined in terms of • Cost • Reliability • Max links (low speed , T1) • “ADAPT_CST” • “DEFAULT”
Scaling • If we have a 100-node problem rather than a 5 node problem • Line types, equipment, and other parameters tables may not change at all • Sites table grows to 100 rows • Traffic table could grow to 10,000 rows • Cost table could grow to 4,950 rows
Scaling (2) • Tables of this size or larger require automation to develop accurately
Homework Session 3 • Read Cahn, Chapter 5 • Do exercises 4.3, 4.4 • Download DELITE and try using it