Download
1 / 1
10 likes | 173 Views
Crust and upper mantle structure of Tien Shan Orogen and its surroundings by ambient noise tomography and earthquake tomography. Yong Zheng a , Yingjie Yang a,b , Weisen Shen b , and Michael H. Ritzwoller b

E N D
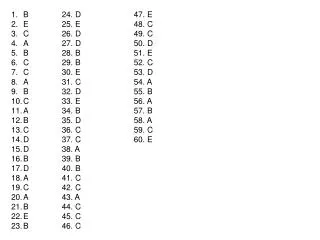
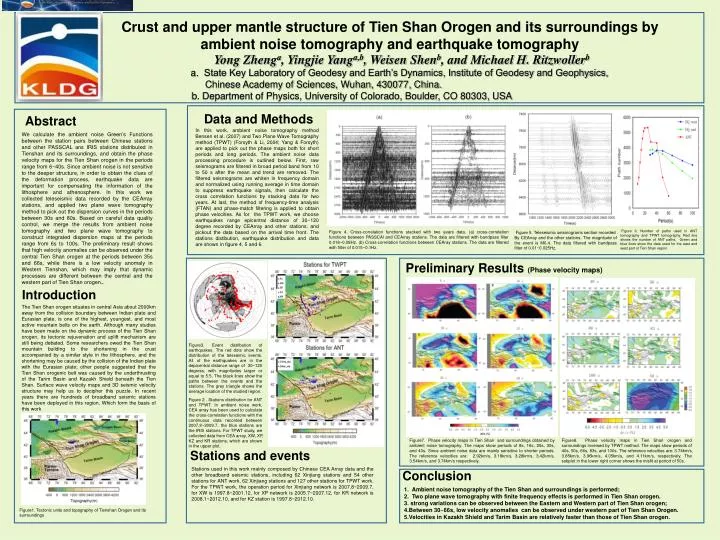
Crust and upper mantle structure of Tien Shan Orogen and its surroundings by ambient noise tomography and earthquake tomography • Yong Zhenga, Yingjie Yanga,b, Weisen Shenb, and Michael H. Ritzwollerb • State Key Laboratory of Geodesy and Earth’s Dynamics, Institute of Geodesy and Geophysics, • Chinese Academy of Sciences, Wuhan, 430077, China. • b. Department of Physics, University of Colorado, Boulder, CO 80303, USA Data and Methods Abstract In this work, ambient noise tomography method Bensen et al. (2007) and Two Plane Wave Tomography method (TPWT) (Forsyth & Li, 2004; Yang & Forsyth) are applied to pick out the phase maps both for short periods and long periods. The ambient noise data processing procedure is outlined below. First, raw seismograms are filtered in broad period band from 10 to 50 s after the mean and trend are removed. The filtered seismograms are whiten in frequency domain and normalized using running average in time domain to suppress earthquake signals, then calculate the cross correlation functions by stacking data for two years. At last, the method of frequency-time analysis (FTAN) and phase-match filtering is applied to obtain phase velocities. As for the TPWT work, we choose earthquakes range epicentral distance of 30~120 degree recorded by CEArray and other stations, and pickout the data based on the arrival time front. The stations distibution, earthquake distribution and data are shown in figure 4, 5 and 6. We calculate the ambient noise Green’s Functions between the station pairs between Chinese stations and other PASSCAL ans IRIS stations distributed in Tienshan and its surroundings, and obtain the phase velocity maps for the Tien Shan orogen in the periods range from 6~40s. Since ambient noise is not sensitive to the deeper structure, in order to obtain the clues of the deformation process, earthquake data are important for compensating the information of the lithosphere and athenosphere. In this work we collected teleseismic data recorded by the CEArray stations, and applied two plane wave tomography method to pick out the dispersion curves in the periods between 30s and 80s. Based on careful data quality control, we merge the results from ambient noise tomography and two plane wave tomography to construct integrated dispersion maps at the periods range from 6s to 100s. The preliminary result shows that high velocity anomalies can be observed under the central Tien Shan orogen at the periods between 35s and 66s, while there is a low velocity anomaly in Western Tienshan, which may imply that dynamic processes are different between the central and the western part of Tien Shan orogen.. Figure 6. Number of paths used in ANT tomography and TPWT tomography. Red line shows the number of ANT paths, Green and blue lines show the data used for the east and west part of Tien Shan region Figure 4. Cross-correlation functions stacked with two years data. (a) cross-correlation functions between PASSCAl and CEArray stations. The data are filtered with bandpass filter 0.018~0.08Hz. (b) Cross-correlation functions between CEAray stations. The data are filtered with filter of 0.015~0.1Hz. Figure 5. Teleseismic seismograms section recorded . By CEArray and the other stations. The magnitude of the event is M6.4. The data filtered with bandpass filter of 0.01~0.025Hz. Preliminary Results (Phase velocity maps) Introduction The Tien Shan orogen situates in central Asia about 2000km away from the collision boundary between Indian plate and Eurasian plate, is one of the highest, youngest, and most active mountain belts on the earth. Although many studies have been made on the dynamic process of the Tien Shan orogen, its tectonic rejuvenation and uplift mechanism are still being debated. Some researchers owed the Tien Shan mountain building to the shortening in the crust accompanied by a similar style in the lithosphere, and the shortening may be caused by the collision of the Indian plate with the Eurasian plate; other people suggested that the Tien Shan orogenic belt was caused by the underthrusting of the Tarim Basin and Kazakh Shield beneath the Tien Shan. Surface wave velocity maps and 3D seismic velocity structure may help us to decipher this puzzle. In recent years there are hundreds of broadband seismic stations have been deployed in this region, Which form the basis of this work Figure3. Event distribution of earthquakes. The red dots show the distribution of the teleseimic events. All of the earthquakes are in the depicentral distance range of 30~120 degress, with magnitudes larger or equal to 5.5. The black lines show the paths between the events and the stations. The grey triangle shows the average location of the studied region. Figure 2 . Stations distribution for ANT and TPWT. In ambient noise work, CEA array has been used to calculate the cross-correlation functions with the continuous data recorded between 2007.8~2009.7. the blue stations are the IRIS stations. For TPWT study, we collected data from CEA array, XW, XP, KZ and KR stations, which are shown in the upper plot. Figure7. Phase velocity maps in Tien Shan and surroundings obtained by ambient noise tomography. The maps show periods of 8s, 16s, 25s, 30s, and 40s. Since ambient noise data are mainly sensitive to shorter periods. The reference velocities are: 2.92km/s, 3.18km/s, 3.28km/s, 3.42km/s, 3.54km/s, and 3.74km/s respectively. Figure8. Phase velocity maps in Tien Shan orogen and surroundings inversed by TPWT method. The maps show periods of 40s, 50s, 66s, 83s, and 100s. The reference velocities are: 3.74km/s, 3.85km/s, 3.96km/s, 4.05km/s, and 4.11km/s, respectively. The subplot in the lower right corner shows the misfit at period of 50s. Stations and events Stations used in this work mainly composed by Chinese CEA Array data and the other broadband seismic stations, including 62 Xinjiang stations and 54 other stations for ANT work, 62 Xinjiang stations and 127 other stations for TPWT work. For the TPWT work, the operation period for Xinjiang network is 2007.8~2009.7, for XW is 1997.8~2001.12, for XP network is 2005.7~2007.12, for KR network is 2008.1~2012.10, and for KZ station is 1997.8~2012.10. Conclusion • 1. Ambient noise tomography of the Tien Shan and surroundings is performed; • 2. Two plane wave tomography with finite frequency effects is performed in Tien Shan orogen. • 3. strong variations can be observed between the Eastern and Western part of Tien Shan orogen; • Between 30~66s, low velocity anomalies can be observed under western part of Tien Shan Orogen. • Velocities in Kazakh Shield and Tarim Basin are relatively faster than those of Tien Shan orogen. Figure1. Tectonic units and topography of Tienshan Orogen and its surroundings