Download
1 / 12
130 likes | 226 Views
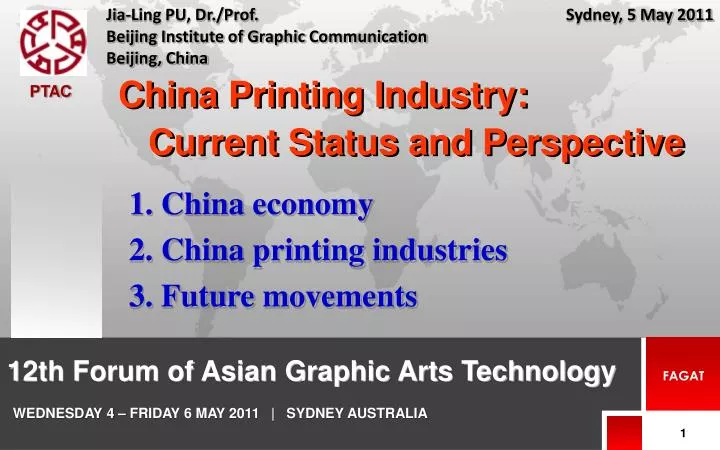
Jia-Ling PU, Dr./Prof. Beijing Institute of Graphic Communication Beijing, China. Sydney, 5 May 2011. PTAC. China Printing Industry: Current Status and Perspective. China Printing Industry: Current Status and Perspective. 1. China economy 2. China printing industries

E N D
Jia-Ling PU, Dr./Prof. Beijing Institute of Graphic Communication Beijing, China Sydney, 5 May 2011 PTAC China Printing Industry: Current Status and Perspective China Printing Industry: Current Status and Perspective 1. China economy 2. China printing industries 3. Future movements 12th Forum of Asian Graphic Arts Technology FAGAT WEDNESDAY 4 – FRIDAY 6 MAY 2011 | SYDNEY AUSTRALIA 1
40 15 30 GDP (Trillion RMB) 20 Annual Growth Rate (%) 10 10 0 5 2000 2001 2002 2003 2004 2005 2006 2007 2008 2009 2010 Year China Economy: GDP and its growth GDP in 2010:39.8 Trillion RMB ( ~ 6.01 Trillion USD) 10.3% 7.2%: the average rate to allow GDP in 2020 to quadruple that in 2000. Source: “China Statistical Yearbook2010” by The National Bureau of Statistics of China
3.0 40 30 2.0 20 Foreign Trade (Trillion USD) Annual Growth Rate (%) 10 1.0 0 -10 0.0 -20 2003 2004 2005 2006 2007 2008 2009 2010 Year China Economy:Foreign trade 2010:Export+Import= 2.97 Trillion USD(+34.7) Export-Import= 183 Billion USD (-6.5%) Source: “China Statistical Yearbook2010” by The National Bureau of Statistics of China
500 30 400 Print Shipment (Billion RMB) 20 300 Annual Growth Rate (%) 10 200 100 2010 2001 2002 2003 2004 2005 2006 2007 2008 2009 Year China Printing Industries: The total print shipment Average Growth Rate: 14.17% Source: The Printing & Equipment Industrial Association of China
Pre-press 26.0 (5.05%) Book&Magzine 95.5 (18.54%) Newspaper 55.0 (10.68%) Packaging 171.5 (33.30%) Commercial 28.6 (6.89%) Foreign Trade 50 (9.71%) Label 13 (2.52%) Screen 11.5 (2.23%) Large-format Ad 6.0 (1.17%) Others 51.0 (9.90%) China Printing Industries: by sector profile The total print shipment in 2009: 515.0 Billion RMB (+8.5%) Top 3 Sectors: (1) Packaging:33.30% (2) Publication: 29.22% (3) Foreign Trade: 9.71% Source: The Printing & Equipment Industrial Association of China
China Printing Industries: Printing and the related industries In 2009 Print Shipment: 515.0 Billion RMB (+8.4%, by PEIAC) ,~ 1.51% of GDP 636.7 Billion RMB (+9.1%, by GAPP),~ 1.87% of GDP Printing Equipments Consumed: 20.6 Billion RMB (-2.6%, by PEIAC) Printing Plates Consumed: 201.8 Million m2 (+11.6%, by PEIAC) Printing Inks Consumed: 480.0 Thousand Tons (+10.6%, by PEIAC) Papers Consumed: 85.69 Million Tons (+2.9%, by PEIAC) Source: The Printing & Equipment Industrial Association of China
China Printing Industries: by Geographic Profile Bohai Rim: ~1/10 of the Total Print Shipment Publication printing Yangtze River Delta: ~1/3 of the Total Print Shipment Packaging printing Pearl River Delta: 1/3 of the Total Print Shipment Foreign trade printing
Future Movements: Accelerated shift from CTF to CTP 2013~2014: CTP= CTF 100 CTF 80 2009: 77.4%(-7.0%) Market Share (%) 60 40 2009:22.6(+7.0%) 20 CTP 0 1999 2001 2003 2005 2007 2009 2011 2013 2015 Year
Future Movements: Digital printing vs traditional printing Area where digital printing rivals traditional printing Low cost digital printing system ~100 pages Over 1000 pages Traditional Printing Cost-per-page Digital Printing Run-length
Future Movements: Digital printing vs traditional printing Traditional Printing: Average Growth Rate between 2001 and 2009: 14.17% CTPlate Market Share: 22.6% (+7.0%) Digital Printing: High two-digit growth maintained over the same period?
Future Movements: Coming up topics Continuingly accelerated shift from CTF to CTP; Continuingly expanded use and faster growth of digital printing; Green printing promoted and driven by government; More market share taken out by print-/publish-on demand; New challenges brought about by FPD- and e-Paper-based new-media; ------------------------------------------------------------
Jia-Ling PU, Dr./Prof. Beijing Institute of Graphic Communication Beijing, China Sydney, 5 May 2011 PTAC Thanks for your attention and Welcome to All-in-Print In Shanghai, November 2011 Thanks for your attention and Welcome to All-in-Print In Shanghai, November 2011 12th Forum of Asian Graphic Arts Technology FAGAT WEDNESDAY 4 – FRIDAY 6 MAY 2011 | SYDNEY AUSTRALIA 12