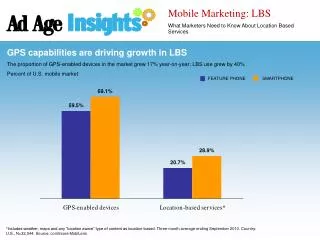
Download
1 / 23
230 likes | 345 Views
Using GPS to Monitor Driving and Parking Habits in Winnipeg for PHEV Optimization. R.Smith 1 , D.Capelle 1 and D.Blair 1 1 University of Winnipeg Department of Geography. Introduction. What is a PHEV?. http://www.eeh.ee.ethz.ch/. Introduction. How do you design a PHEV?.

E N D
Using GPS to Monitor Driving and Parking Habits in Winnipeg for PHEV Optimization R.Smith1, D.Capelle1 and D.Blair1 1University of Winnipeg Department of Geography
Introduction What is a PHEV? http://www.eeh.ee.ethz.ch/
Introduction How do you design a PHEV? • Power Requirements: Distance, Speed, Acceleration and Duration • Time available for Battery Recharging
Purpose • Determine the energy demands placed on a PHEV by a typical driver • Identify the most suitable public locations for recharging PHEVs • Decrease vehicle emissions & petroleum dependence
Participants • 100 Drivers from Winnipeg & nearby communities • One year period • Recruitment: • Local media • Word-of mouth • First come first served basis
Equipment • 100 GPS receivers (Otto Driving Companion) • Store 300 hours of data @ one-second intervals • Plug-in to vehicle lighter socket • Transfer data to PC via USB cable • Accuracy: • Position: 10 metres • Speed: 1 km/h myottomate.com/checkoutotto.asp
Duty Cycle Analysis arcx.com/sites/images/Photos/Underground parking lot at Square One.jpg
Vehicle Power Demand – the Duty Cycle • A representative, 24-hour profile • Duty Cycles can indicate: • Typical speed and acceleration demands • Hours of the day vehicle is in operation • Number of Trips / Day • Time available for Recharging • Measured: Pre-determined route, single vehicle • Derived: Multiple vehicles, thousands of trips over long periods of time
Duty Cycle Construction • How many Trips / Cycle ? • What is the trip origin and destination ? • What hour of the day ? • How long and far is the trip ? • Speed and acceleration ? • What is “Average” or “Typical” ?
HOME WORK Isolating Specific Trips HOME to WORK
Simplifying Trips CONGESTED FLOW IDLE CREEP IDLE UN-CONGESTED FLOW
Creating “Blueprints” Idling Micro-trips Creep Un-congested Traffic Flow % Congested Traffic Flow Micro-Trip Types
Reconstructing Trips X 100
Reconstructing Trips Average Speed Distance 22 km/h 6.5 km
Duty Cycle Construction HOME to WORK WORK to SCHOOL SCHOOL to HOME HOME to SHOPPING SHOPPING to HOME TOTAL DISTANCE = 25.4 km TOTAL DURATION = 1:02:54
Parking Analysis arcx.com/sites/images/Photos/Underground parking lot at Square One.jpg
Suitability Criteria • Maximum public availability • Widely-used parking lots • Maximum re-charge potential • Long mean parking duration • Low Impact on Electric Grid • “Off-peak electric demand” parking
Filtering & Manipulation • Isolate only Trip-ends from data set • Parking locations • Calculate Duration of all Parking Events • Time difference between trip-end and next trip-start • Parking On/Off-peak electric demand
STATISTICS STATISTICS GP-1 GP-2 GP-3 GP-4 GP-5 # participants 68 # Participants 58 65 20 10 2 mean duration 96 mins Mean Duration (mins) 96 101 72 120 118 On-peak/ Off-peak 78 / 85 (0.92) On-peak/Off-peak 1.1 1.3 1.20 0.93 0.87 Potentially Suitable Lots:Individual Lot Analysis
Ranking Parking Lots Suitability Criteria • Widely-used • Long mean-parking duration • Low impact on electric grid
Conclusion The Good: • GPS and GIS ideal for identifying suitable locations for PHEV recharge infrastructure • Applicable to other cities The Bad: • Sample size too small • GPS data errors
Acknowledgments • Soheil Shahidinejad, Department of Engineering, University of Manitoba • Dr. Jeff Babb, Department of Math and Stats, University of Winnipeg • Brad Russell, Department of Geography: Map Library, University of Winnipeg • Centre for Forest Interdisciplinary Research (C-FIR) • Pam Godin, Leif Norman and Laura Redpath • Terry Zdan and Dr. Arne Elias, The Centre for Sustainable Transportation (CST) Funding and Support