Download
1 / 54
570 likes | 939 Views
Univariate EDA. (Exploratory Data Analysis). EDA. John Tukey (1970s) data two components: smooth + rough patterned behaviour + random variation resistant measures/displays little influenced by changes in a small proportion of the total number of cases

E N D
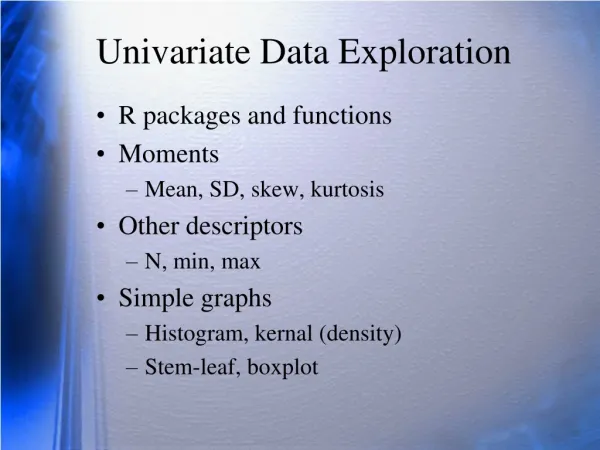
Univariate EDA (Exploratory Data Analysis)
EDA • John Tukey (1970s) • data • two components: • smooth + rough • patterned behaviour + random variation • resistant measures/displays • little influenced by changes in a small proportion of the total number of cases • resistant to the effects of outliers • emphasizes smooth over rough components • concepts apply to statistics and to graphical methods
Tree Ring dates (AD) 1255 1239 1162 1239 1240 1243 1241 1241 1271 • 9 dendrochronology dates • what do they mean???? • usually helps to sort the data…
1162 1239 1239 1240 1241 1241 1243 1255 1271 Stem-and-Leaf Diagram 11|62 12|39,39,40,41,41,43,55,71 • original values preserved • no rounding, no loss of information…
can simplify in various ways… 11|6 12|44444467 • ‘leaves’ rounded to nearest decade • ‘stem’ based on centuries
1162 1239 1239 1240 1241 1241 1243 1255 1271 116|2117|118|119|120|121|122|123|99124|0113125|5126|127|1 ‘stem’ based on decades…
1162 1239 1239 1240 1241 1241 1243 1255 1271 116|2117|118|119|120|121|122|123|99124|0113125|5126|127|1 highlights existence of gaps in the distribution of dates, groups of dates…
R • stem() • vuround(runif(25, 0, 50),0); stem(vu) • vnround(rnorm(25, 25, 10),0); stem(vn) • stem(vn, scale=2)
Back-to-back stem-and-leaf plot rimdiameterdata (cm)
percentiles • useful for constructing various kinds of EDA graphics • don’t confuse percentile with percent or proportion Note: • frequency = count • relative frequency = percent or proportion
percentiles “the pth percentile of a distribution: number such that approximately p percent of the values in the distribution are equal or less than that number…” • can be calculated for numbers that actually exist in the distribution, and interpolated for numbers than don’t…
percentiles • sort the data so that x1 is the smallest value, and xn is the largest (where n=total number of cases) • xi is the pith percentile of a dataset of n members where:
p1 = 100(1 - 0.5) / 7 = 7.1 p2 = 100(2 - 0.5) / 7 = 21.4 p3 = 100(3 - 0.5) / 7 = 35.7 p4 = 100(4 - 0.5) / 7 = 50 etc… [1]
? ? 25 85 50 50th percentile:i=(7*50)/100 + .5i=4, xi=7 25th percentile:i=(7*25)/100 + .5i=2.25, 3<xi<5
? 25 25th percentile:i=(7*25)/100 + .5i=2.25, 3<xi<5 if i < > integer, then…k = integer part of i; f = fractional part of ixint = interpolated value of x xint = (1-f)xk + fxk+1xint= (1-.25)*3+.25*5 xint= 3.5
use R!! • test<-c(1,3,5,7,9,9,14) • quantile(test, .25, type=5)
“boxplot” inner fence lower hinge upper hinge inner fence interquartilerange(midspread) (1.5 x midspread) percentiles: 25th 50th 75th
Figure 6.25: Internal diversity of neighbourhoods used to define N-clusters, measured by the 'evenness' statistic H/Hmax on the basis of counts of various A-clusters, and broken down by N-cluster and phase. [Boxes encompass the midspread; lines inside boxes indicate the median, while whiskers show the range of cases that fall within 1.5-times the midspread, above or below the limits of the box.]
Histograms • divide a continuous variable into intervals called ‘bins’ • count the number of cases within each bin • use bars to reflect counts • intervals on the horizontal axis • counts on the vertical axis
counts percent “bins” Histogram
Histograms • useful for illustrating the shape of the distribution of a batch of numbers • may be helpful for identifying modes and modalbehaviour
mode mode? mode! • the distribution is clearly bimodal • may be multimodal…
important variables in histogram constuction: • bin width • bin starting point
smoothing histograms • may want to accentuate the ‘smooth’ in a data distribution… • calculate “running averages” on bin counts • level of smoothing is arbitrary…
histogram / barchart variations • 3d • stacked • dual • frequency polygon • kernel density methods
Site 1 Site 2
controlling kernel density plots… • hd <- density(XX) • hh <- hist(XX, plot=F) • maxD <- max(hd$y) • maxH <- max(hh$density) • Y <- c(0, max(c(maxD, maxH))) • hist(XX, freq=F, ylim=Y) • lines(density(XX))
1 2 3 4 5 6 7 8 9 10 1 2 3 4 5 6 7 8 9 10 VAR00003 VAR00003 1 2 3 4 5 6 7 8 9 10 VAR00003 Dot Histogram [R: stripchart()] method = “stack”
line plot cooking/service service ritual
cooking/service service ritual
20% 19% 22% 18% 21% pie chart