Download
1 / 20
210 likes | 351 Views
HOMOGENIZATION OF MONTHLY TEMPERATURE SERIES IN ROMANIA (1901-2005) USING METADATA. Sorin CHEVAL*, Tam á s SZENTIMREY**, Ancuţa MANEA*** *National Meteorological Administration, Bucharest, Romania and Euro-Mediterranean Centre for Climate Change, Venice, Italy

E N D
HOMOGENIZATION OF MONTHLY TEMPERATURE SERIES IN ROMANIA (1901-2005) USING METADATA Sorin CHEVAL*, Tamás SZENTIMREY**, Ancuţa MANEA*** *National Meteorological Administration, Bucharest, Romania and Euro-Mediterranean Centre for Climate Change, Venice, Italy ** Hungarian Meteorological Service, Budapest, Hungary ***National Meteorological Administration, Bucharest, Romania
Rationale: • The meteorological network suffered multiple major changes along the 20th century: transfers between different administrative or political regimes, relocations, wars, changing of instruments/shelters etc. • Previous studies approached the variability of the annual temperatures in Romania based on raw data, and paid little attention to homogenization • No homogenized climatic datasets for Romania
Objectives: • To investigate the homogeneity level of the monthly temperature series recorded at weather stations from Romania in the period 1901-2005 • To test MASH • Significance of metadata
Meteorological Network – Romania 2008 160 weather stations, most of them cover the interval 1961-present, cca. 90 stations automatic
Data: Monthly average temperatures 1901-2005 31 stations Romania + 4 stations Hungary (homogenized) Metadata: -relocation -turning from manually operated to automatic weather stations
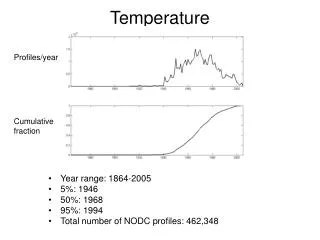
Temporal distribution of relocations or automatization of stations Automatization of stations
The homogenization of the dataset used the Multiple Analysis of Series for Homogenization (MASH) v3.02, and took benefit of the metadata existing in the archives of the National Meteorological Administration • The MASH system can use the metadata information – in particular the probable dates of break points – automatically • Homogenized temperature series from Hungary near the border were also used during the procedure in order to increase the power.
PROBLEM of HOMOGENIZATION • Basis: DATA • Tools: • MATHEMATICS : abstract formulation • META DATA : historical, climatological information • SOFTWARE : automatization • SOLUTION = MATHEMATICS + META DATA + SOFTWARE • (i) without SOFTWARE: MATHEMATICS + META DATA = THEORY WITHOUT BENEFIT • (ii) without META DATA: MATHEMATICS + SOFTWARE = GAMBLING • (iii) without MATHEMATICS: META DATA + SOFTWARE = “STONE AGE” + “BILL GATES”
BASIC PRINCIPLES of MASH Procedure • Relative homogeneity test procedure • Step by step procedure: the role of series (candidate or reference series) changes step by step in the course of the procedure • Additive or cumulative model can be used depending on the climate elements • Monthly, seasonal or annual time series can be homogenized together (SAM procedure: Seasonal Application of MASH) • META DATA (probable dates of break points) can be used automatically • The actual or the final stage of the homogenization can be verified.
Methodology: • Homogenized for 0.05 level of confidence • Three homogenization instances: 1. no metadata considered 2. metadata1: relocation of the stations 3. metadata2: relocation of the stations and automatization
I. TEST STATISTICS FOR SERIES INHOMOGENEITY Null hypothesis: the examined series are homogeneous. Critical value (significance level 0.05): 21.73 Test statistics (TS) is compared to the critical value. The larger TS values are more suspicious! After homogenization Before homogenization
Evaluation of metadata IV. TEST STATISTICS Null hypothesis: the inhomogeneities can be explained by the Meta Data. Critical value (significance level 0.05): 21.73 Test statistics (TSM) can be compared to the critical value. The larger TSM values are more suspicious!
ESTIMATED BREAK POINTS AND SHIFTS AR: 1904: -0.04/ 1905: -0.08/ 1908: 0.09/ 1909: 0.15/ 1910: 0.13/ 1914: -0.02/ 1919: 0.01/ 1922: -0.03/ 1923: -0.06/ 1924: 0.06/ 1926: 0.06/ 1927: 0.12/ 1928: 0.07/ 1929: 0.02/ 1935: 0.04/ 1937: 0.01/ 1939: 0.02/ 1940: -0.08/ 1941: 0.12/ 1944: 0.02/ 1952: 0.01/ 1953: 0.03/ 1958: -0.01/ 1964: 0.03/ 1966: 0.01/ 1972: 0.08/ 1974: 0.03/ 1975: 0.02/ 1983: 0.01/ 1987: 0.02/ 1999: -0.01/ 2001: -0.03 ESTIMATED BREAK POINTS AND SHIFTS (Mark M: META DATA 1) AR: 1904: -0.03/ 1905: -0.04/ 1908: 0.08/ 1909: 0.15/ 1910: 0.18/ 1921: -0.01/ 1922: -0.04/ 1923: -0.10/ 1924: 0.05/ 1926: 0.05/ 1927: 0.10/ 1928: 0.13/ M1936: 0.04/ 1940: 0.03/ M1951: 0.03/ M1972: 0.07/ 1999: -0.02/ 2001: -0.03 ESTIMATED BREAK POINTS AND SHIFTS (Mark M: META DATA 2) AR: 1904: -0.03/ 1905: -0.04/ 1908: 0.08/ 1909: 0.15/ 1910: 0.18/ 1921: -0.01/ 1922: -0.04/ 1923: -0.10/ 1924: 0.04/ 1926: 0.06/ 1927: 0.10/ 1928: 0.13/ M1936: 0.04/ 1940: 0.03/ M1951: 0.03/ M1972: 0.06/ M1999: -0.09/ 2000: 0.04
Concluding remarks and further developments • A major part of the long-term monthly temperature variations in Romania is caused by natural factors, but in some cases the changing in the weather stations location and/or automatization have induced artificial leaps in the series • Metadata = very useful, but they cannot explain everything! • More metadata (very possible) • Efforts for series reconstruction (carefully) • Bordering problems (possible) • More methods (very possible)