Download
1 / 14
140 likes | 237 Views
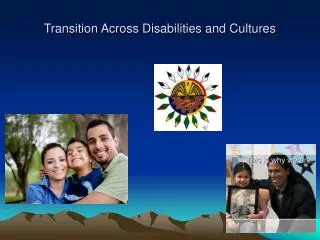
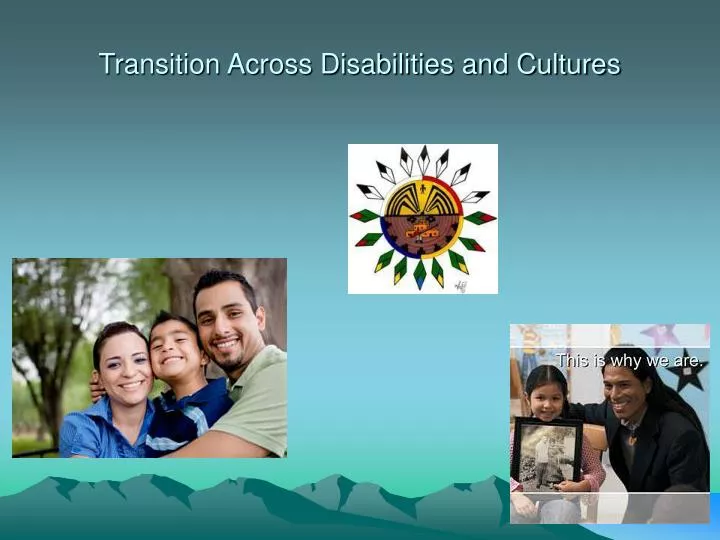
Transition Across Disabilities and Cultures. Group Focus.

E N D
Group Focus • While school-to-work transition follows a well-determined path (if not one yet based in evidence), group differences can color the meaning and change the measure of our interventions. Service must be flexible enough to adapt to these differences. Culture and disability stand out as two fundamental schemas that mediate the meaning (individually and in interaction) of work, education, transition, and success in the lives of student /clients and their communities. How does evaluation change across disability types and cultural contexts such that best practice in transition is properly served?
Historical Legislation • IDEA • Rehabilitation Act of 1973 • Sections 501-504 • IDEA Part B and Workforce Investment Act • Applications of Laws
Challenges • Youth of color age 18-24 are less likely to make the successful transition to adulthood
Delivery of Services to Cultural Groups • “American Indian and Alaska Native students are more likely than students of other racial and ethnic groups to receive services under the Individuals with Disabilities Education Act (IDEA). Specifically, about 14 percent of American Indian and Alaska Native students received IDEA services in 2006, compared to 8 percent of white, 11 percent of black, 8 percent of Hispanic, and 5 percent of Asian/Pacific Islander students.”
Disability Types • Table demonstrates Improvements in the school exit of youth with disabilities • Between 1987-2003
Assessments • Observations • Interviews • Record Reviews • Testing and Performance Activities • Formal Testing • Student/Family Participation in Transition
Intellectual Disabilities • psychological testing services • Behavioral, social or emotional disorders, assessments • Ms. Hullinger is reluctant to use standardized testing to assess what skills her students possess (School Interview)
Learning Disabilities • interview with a Special Education teacher which provides a perspective on education and assessment on youth with disabilities. • Granite School District in Salt Lake Utah
TABLE I Characteristics of Focus Students by Disability Category Students With EBD (n=59) Students With LD (n= 101) All Students(N=160) Variable % M (SD) % M (SD) % M (SD) Age 17.3 (1.2) 17.1 (1.3) 17.2 (1.3) Gender Female 20.3 37.6 31.3 Male 79.7 62.4 68.8 Race/ethnicity American Indian 0 2.0 1.3 Latino 0 3.0 1.9 Not reported 1.7 0 0.6 Grade 9 13.6 18.8 16.9 10 35.6 28.7 31.3 11 25.4 28.7 27.5 12 25.4 23.8 24.3 Note. EBD = emotional and/or behavioral disorders, including Autism/ASD; LD = learning disabilities. Hoffmnan, L. (2009). Numbers and Vpes of-public elementary and secondary schools from the common core of data: School year 2006-07. Washington, DC: National Center for Education Statistics, Institute of Education Sciences.
TABLE 2 Teacher Ratings of Focus Students by Domain and Disability Group % Ranking % Ranking……… Domain 0 or l 2 or 3 4 or 5 M (SD) NA DK Community participation EBD 16.4 41.0 25.1 2.75 (1.21) 1.7 15.5 LD 10.4 40.3 32.2 3.08 (1.08) 5.0 12.2 Further education EBD 22.1 34.5 23.8 2.86 (1.34) 14.5 4.8 LD 9.5 33.5 32.3 3.27 (1.11) 20.2 4.6 Employment EBD 16.6 38.3 41.7 3.02 (1.20) 0.3 3.1 LD 6.1 33.9 56.6 3.65 (0.93) 0.2 3.2 Self-determination EBD 13.6 47.5 36.3 3.12 (1.05) 0.0 2.7 LD 4.0 31.9 61.2 3.84 (0.87) 0.2 2.8
Best practices • Empirical Research • Instruments use relevant to current disability • Reliability Validity & Utility of instruments • Applications • Evaluations • Cultural and Disabilities Implications
References • Bolton, BF. & Parker. RM. (2008). Handbook of Measurement and Evaluation in Rehabilitation 4th ed. Austin, TX:PRO-ED., 7, 180. • Dana, R. H. (1996). Culturally competent assessment practice in the U.S. Journal of Personality Assessment, 66, 472-487 • Wagner, Mary., Newman, Lynn., Cameto, Renee., & Lovino, Phyllis. (2005). National Longitudinal Transitional Study 2. Changes Over time in The Early Postschool Outcomes Of Youth With Disabilities. SRI International. • U.S. Department of Education, National Center for Education Statistics, Status and Trends in the Education of American Indians and Alaska Natives: 2008. • Uniqual opportunities For Youth in Transition. (2011). Race Matters. www.aedf.org/upload/publicationfiles/fact_sheet5.pdf. • http://www.ncptc.org/vertical/Sites/%7B8634A6E1-FAD2-4381-9C0D-5DC7E93C9410%7D/uploads/%7B688EE7F6-7E78-4B65-97A6-089C756EEAA1%7D.PDF • http://www.ncwd-youth.info/assets/guides/assessment/AssessGuideComplete.pdf • http://clas.uiuc.edu/techreport/tech7.html