Download
1 / 7
70 likes | 217 Views
Activity:. In five days, it snowed 4 inches, 3 inches, 5 inches, 1 inch, and 2 inches. 4 in 3 in 5 in 1 in 2 in Move the cubes until each stack has the same number of cubes. Oklahoma Math Connects Course 1 – Glencoe 2011 – pg. 102.

E N D
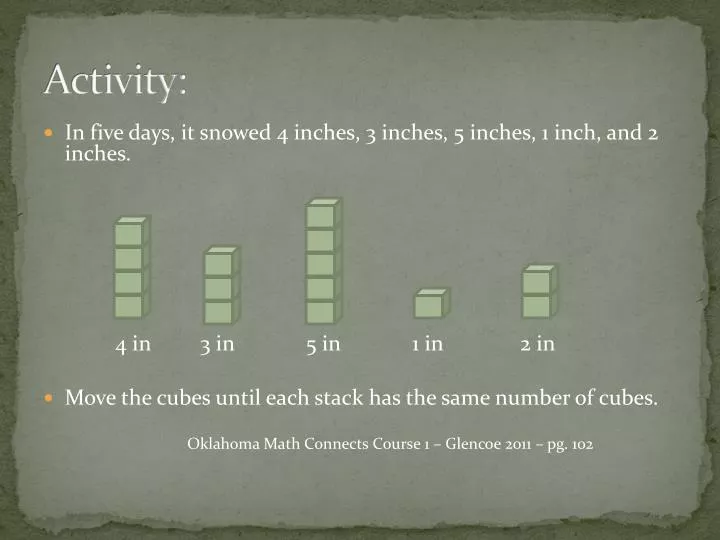
Activity: • In five days, it snowed 4 inches, 3 inches, 5 inches, 1 inch, and 2 inches. 4 in 3 in 5 in 1 in 2 in • Move the cubes until each stack has the same number of cubes. Oklahoma Math Connects Course 1 – Glencoe 2011 – pg. 102
Activity Summary: • 1. On average, how many inches did it snow per day in five days? Explain your reasoning. • 2. Suppose on the sixth day it snowed 9 inches. If you moved the cubes again, how many cubes would be in each stack. Oklahoma Math Connects Course 1 – Glencoe 2011 – pg. 102
Mean (or average) – the results from equally distributing all the data in a set. The mean can be found in either of the following ways • The mean can be found by leveling all the values to have an equal distribution. • http://www.shodor.org/interactivate/activities/PlopIt/ • The mean is the sum of the data divided by the number of pieces of data. • Ex. Data set: 4, 3, 2, 5, 1 • Mean: 4 + 3 + 2 + 5 + 1 5 = 15/5 Mean = 3
Find the mean of the data sets below. • Years of experience on a baseball team • Cell phone usage 478 295 780 685 570 588 495 390 587 376 4 6 3 2 1 0 6 4 5 3 2
Outliers • Outliers are values that are much higher or lower than others in a data set Chapter 5 Test Scores 1. Calculate the mean of the data set. 2. Calculate the mean leaving out the score of 0. 3. Calculate the mean leaving out both the 20 and the 0. 100 99 98 96 95 88 86 81 79 76 66 64 52 20 0 Answers: 1. 73.3, 2. 78.6, 3. 83.1
Identify the outlier(s) in these costs: • $115, $125, $55, $135, $400, $105, $115, $140 • Calculate the mean of the data set. • Calculate the mean of the data set without the outlier(s). Answers: The outliers would be $400 and $55. The mean of the entire data set is $148.75. The mean without the outliers is $122.50.
Write at least three sentences describing how outliers can distort calculations of the mean.