Download
1 / 40
400 likes | 536 Views
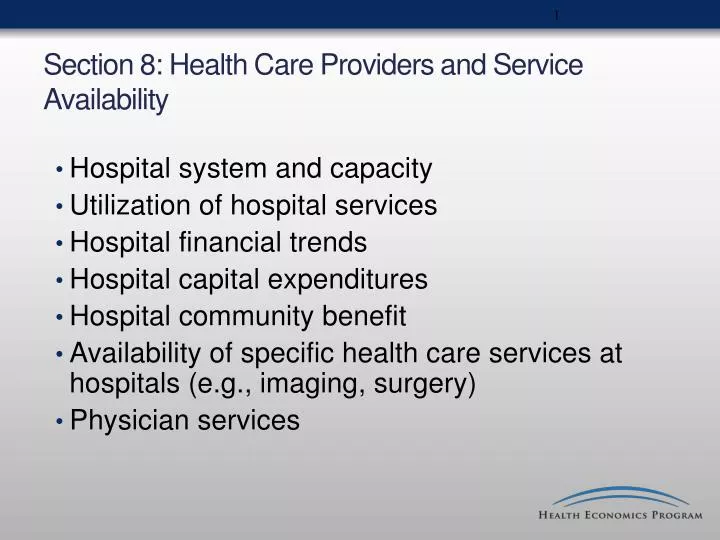
Hospital system and capacity Utilization of hospital services Hospital financial trends Hospital capital expenditures Hospital community benefit Availability of specific health care services at hospitals (e.g., imaging, surgery) Physician services.

E N D
Hospital system and capacity Utilization of hospital services Hospital financial trends Hospital capital expenditures Hospital community benefit Availability of specific health care services at hospitals (e.g., imaging, surgery) Physician services Section 8: Health Care Providers and Service Availability
Hospital Capacity in Minnesota, 2012 *Available beds is defined as the number of acute care beds that are immediately available for use or could be brought online within a short period of time. **Licensed beds is defined as the number of beds licensed by the Department of Health, under Minnesota Statutes, sections 144.50 to 144.58. Source: MDH Health Economics Program analysis of hospital annual reports, U.S. Census Bureau Unless otherwise noted, all data is this section is for each hospital’s fiscal year.
5 Regional Hospital Capacity in Minnesota, 2012 *Available beds is defined as the number of acute care beds that are immediately available for use or could be brought online within a short period of time. **Licensed beds is defined as the number of beds licensed by the Department of Health, under Minnesota Statutes, sections 144.50 to 144.58. Source: MDH Health Economics Program analysis of hospital annual reports.
Distribution of Minnesota’s Hospitals by Size and Region, 2012 By Number of Available Beds Source: MDH Health Economics Program analysis of hospital annual reports.
Ownership of Minnesota Hospitals, 2012 Government, 34, 25.6% City: 7.5% County: 5.3%City and County: 1.5%District: 11.3% Source: MDH Health Economics Program analysis of hospital annual reports.
Affiliation of Minnesota Community Hospitals, 1992-2012 Number of Hospitals Source: MDH Health Economics Program analysis of hospital annual reports.
Largest Minnesota Hospital Systems, 2002-2012 Number of Hospitals *Previously known as Sioux Valley. Changes in the number of hospital affiliations impact trend lines over time. **Essentia represents the merger of Benedictine and SMDC systems and includes both systems over time. Source: MDH Health Economics Program analysis of hospital annual reports.
Minnesota Hospital System Ownership, 2012 Source: MDH Health Economics Program analysis of hospital annual reports. *Hospitals with multiple affiliations are counted under each affiliation; for hospitals with multiple affiliations available beds are divided across systems equally.
Composition of Minnesota’s Hospital Workforce, 2012 *Includes nurse anesthetists, nurse practitioners, and physician assistants. Other is reported as grouped category of positions.Source: MDH Health Economics Program analysis of hospital annual reports.
Minnesota Hospital Outpatient Visits and Inpatient Admissions, 2002 to 2012 Outpatient visits Inpatient admissions Admissions Outpatient visits Source: MDH Health Economics Program analysis of hospital annual reports.
Average Length of Stay in Minnesota Hospitals, 2002 to 2012 Average length of stay (days) Source: MDH Health Economics Program analysis of hospital annual reports. Average length of stay grew by 1.9% in 2012 but due to rounding it appears constant.
Average Length of Stay: Rural and Urban Minnesota Hospitals, 2002 to 2012 Average length of stay (days) A hospital is defined as rural if it is located in a county that is not part of a metropolitan statistical area. Source: MDH Health Economics Program analysis of hospital annual reports.
Minnesota Hospital Utilization by Region, 2012 Source: MDH Health Economics Program analysis of hospital annual reports.
Distribution of Hospital Admissions and Inpatient Days by Type of Service, 2012 Source: MDH Health Economics Program analysis of hospital annual reports.
Trend in Outpatient Surgeries at Minnesota Hospitals, 2002 to 2012 Source: MDH Health Economics Program analysis of hospital annual reports.
Trend in Emergency Room Visits at Minnesota Hospitals, 2002 to 2012 Emergency Room Visits in Thousands Source: MDH Health Economics Program analysis of hospital annual reports.
Net Assets of Minnesota Hospitals, 2002 to 2012 Billions of dollars Source: MDH Health Economics Program analysis of hospital annual reports. Net assets is an accounting term defining the total assets minus the total liabilities, and describes the hospital’s financial position.
Net Income of Minnesota Hospitals, 2002 to 2012 Millions of dollars Source: MDH Health Economics Program analysis of hospital annual reports.
Minnesota Hospitals' Net Income as a Percent of Revenue, 2002 to 2012 Source: MDH Health Economics Program analysis of hospital annual reports.
Hospital Financial Indicators by Region, 2012 Source: MDH Health Economics Program analysis of hospital annual reports.
Hospital Financial Indicators by Hospital Size, 2012 Number of available beds. Source: MDH Health Economics Program analysis of hospital annual reports.
Sources of Patient Revenue for Minnesota Hospitals, 2012 *Includes Medical Assistance and MinnesotaCare. A hospital is defined as rural if it is located in a county that is not part of a metropolitan statistical area. Source: MDH Health Economics Program analysis of hospital annual reports.
Capital Expenditure Commitments by Minnesota Hospitals, 2012 Major spending commitments that are reportable under 62J.17 include expenditures in excess of $ 1 million. Spending commitments are sorted by the reported calendar date of the spending commitment and the 2011 figures reflect 2011 projects reported in the 2012 fiscal year and is a revision over previous pulbications. A small portion of capital expenditure data may belong to earlier reporting periods. Source: MDH Health Economics Program analysis of hospital annual reports.
Minnesota Hospital Capital Expenditure Commitments by Type, 2012 Source: MDH Health Economics Program analysis of hospital annual reports.
Minnesota Hospital Capital Expenditure Commitment by Category, 2012 Major spending commitments that are reportable under 62J.17 include expenditures in excess of $ 1 million. Source: MDH Health Economics Program analysis of hospital annual reports.
Community Benefit Provided by Minnesota Hospitals, 2012 Source: MDH Health Economics Program analysis of hospital annual reports.
Distribution of Minnesota Hospitals’ Community Benefit by Category, 2012 Source: MDH Health Economics Program analysis of hospital annual reports.For definitions see: MDH/Health Economics Program, “Community Benefit Provided by Minnesota Hospitals in 2007, and forthcoming 2012 report,” (www.health.state.mn.us/healtheconomics).
Services Available in Minnesota Hospitals, 2012 *Services are considered “available” when they are provided on site by hospital staff, on site through contracted services, or off site through shared services agreement. Source: MDH Health Economics Program analysis of hospital annual reports.
Number of Physicians Practicing in Minnesota, 2012 Primary Care includes: General Family Medicine, General Internal Medicine, General Pediatrics. No Certification means there were no board certifications on the record received from the Minnesota Board of Medical Practice. Source: Minnesota Board of Medical Practices, analysis of MDH, Office of Rural Health & Primary Care.
Number of Physicians Practicing in Minnesota by MSA and Non-MSA Counties, 2012 MSA Definitions, 2010 Census. Note: Due to methodology changes, past Chartbook data should not be used for comparison. Source: Minnesota Board of Medical Practices, analysis by MDH, Office of Rural Health & Primary Care.
Distribution of Number of Physicians Practicing in Minnesota by Location and Specialty, 2012 MSA Definitions, Census 2010. Note: Due to methodology changes, past Chartbook data should not be used for comparison. Source: Minnesota Board of Medical Practices, analysis by MDH, Office of Rural Health & Primary Care.
Health Economics Program Home Page • www.health.state.mn.us/divs/hpsc/hep/index.html • Publications • www.health.state.mn.us/divs/hpsc/hep/publications/yearly/2010.html • Health Care Market Statistics (Chartbook Updates) • www.health.state.mn.us/divs/hpsc/hep/chartbook/index.html • Interactive Health Insurance Statistics • https://pqc.health.state.mn.us/mnha/Welcome.action Additional Information from the Health Economics Program Available Online