Download
1 / 8
80 likes | 206 Views
Practical application: Guadiana river basin water footprint (Spain). Water Footprint and Virtual Water Trade Side event Water Observatory - M. Botin Foundation 5th World Water Forum, Istanbul, 18 March 2009 Side publication of the WWDR-3 Joint venture of M. Botin Foundation and NeWater.

E N D
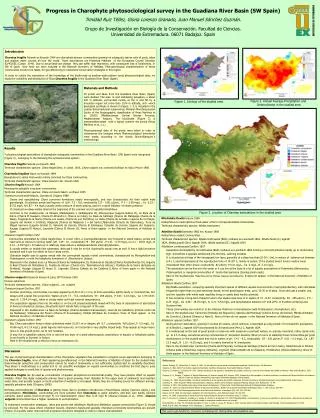
Practical application: Guadiana river basin water footprint (Spain) Water Footprint and Virtual Water Trade Side event Water Observatory - M. Botin Foundation 5th World Water Forum, Istanbul, 18 March 2009 Side publication of the WWDR-3 Joint venture of M. Botin Foundation and NeWater Maite M. Aldaya m.m.aldaya@ctw.utwente.nl University of Twente M. Ramón Llamas mrllamas@geo.ucm.es Complutense University of Madrid
Guadiana WF Water footprint with distinction of green and blue water (surface and groundwater) and related economic analysis for the Guadiana basin • First time applied in a river basin in this way • A recent Spanish regulation requires the WF analysis for the preparation of the EU river basin management plans that MS have to send to the EU in 2009, and then every 6 years. Source: CHG (2008)
142 905 745 3 10 21 34 74 43 Guadiana WF: Water consumption Agricultural use of water resources in the Guadiana (Mm3/year)(2001) CUENCA TOLEDO CÁCERES 835 1286 93 CIUDAD REAL UPPER GUADIANA BADAJOZ ALBACETE MIDDLE GUADIANA CÓRDOBA HUELVA LOWER GUADIANA PROVINCES GREEN WATER UPPER GUADIANA BLUE SURFACE WATER SEVILLA MIDDLE GUADIANA BLUE GROUNDWATER LOWER GUADIANA FORMER LOWER GUADIANA II OR TOP DOMAIN TOP DOMAIN 0 25 50 100 150 200 Km Source: Aldaya and Llamas (2009)
Guadiana WF: Crop area Distribution of crops UPPER GUADIANA MIDDLE GUADIANA Irrigated agriculture Rainfed agriculture Irrigated agriculture Rainfed agriculture Vineyard Vineyard Vineyard 6% 6% Vineyard 8% Grain cereals Grain cereals Grain cereals 15% Vineyard Olive tree Olive tree Grain cereals Grain cereals 34% 46% 46% 46% 23% 23% Olive tree 37% 36% 10% Temperate climate fruit trees Temperate climate fruit trees Olive tree 25% 25% 25% Grain legumes Grain legumes 4% Grain legumes 4% 4% 3% Vegetables Vegetables Industrial crops 5% Fallow land Fallow land Industrial crops Olive tree 10% 10% 4% Fodder Industrial crops 26% Industrial crops Industrial crops Fodder Fodder 19% 2% 5% 3% Vegetables 7% 7% 6% 5% 2% 5% TOP LOWER GUADIANA Greenhouses 2% Vineyard Grain cereals Vineyard Olive tree Grain cereals 6% 5% Industrial crops 7% Olive tree 5% Olive tree 6% 4% Olive tree Grain cereals 14% 19% Temperate climate fruit trees 7% Fodder 26% Industrial crops Grain cereals 7% 34% Temperate climate fruit trees Dry fruit trees 13% 9% Vegetables Dry fruit trees 3% 11% 10% 12% Fodder Vegetables 3% Fallow land 22% Citrus Industrial crops 27% 38% Citrus Fallow land 15% 38% 47%
Guadiana WF: Water consumption Water footprint related to production and economic value in the Guadiana basin (2001) *These data do not include trade. Source: Aldaya and Llamas, 2009
Guadiana WF: €/m3 Blue water economic productivity (€/m3) concerning agricultural water consumption per crop 12 12 Upper Upper Guadiana Guadiana Average (2001) Average (2001) Middle Middle Guadiana Guadiana 10 10 TOP TOP Lower Lower Guadiana Guadiana 8 8 €/m3 6 6 4 4 2 2 0 0 16 16 Humid (1997) Humid (1997) 14 14 12 12 €/m3 10 10 8 8 6 6 4 4 2 2 0 0 16 16 Dry (2005) Dry (2005) 14 14 12 12 €/m3 10 10 8 8 6 6 4 4 2 2 0 0 Grain Grain Grain Grain Potatoes Potatoes Industrial Industrial Vegetables Vegetables Citrus Citrus Olive tree Olive tree Vineyard Vineyard cereals cereals legumes legumes crops crops
Guadiana WF: Conclusions CONCLUSIONS • Agriculture main water consuming sector (95%), low €/m3 • Most of the water is used for low economic value crops. This is typical for continental agriculture in Spain. • Economic water productivity (€/m3): 1.5 - 15 vegetables 1 - 3 vineyards 0.5 - 1 olive trees 0.1 - 0.2 cereals • Surface and groundwater distinction. Outcomes not very different due to several factors: legal restrictions in GW use, one of the most regulated river basins in Spain. • From “more crops and jobs per drop” towards “more cash and nature per drop”