Download
1 / 63
630 likes | 806 Views
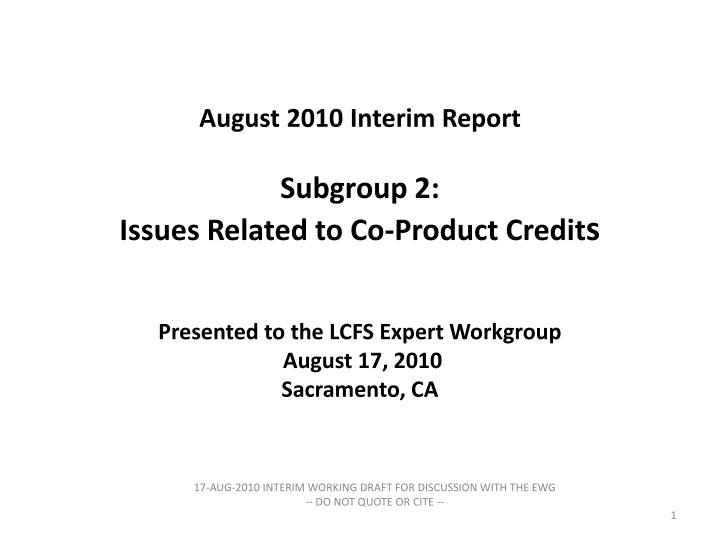
August 2010 Interim Report Subgroup 2: Issues Related to Co-Product Credit s Presented to the LCFS Expert Workgroup August 17, 2010 Sacramento, CA. Subgroup 2 Membership. Alan Glabe, ARB Staff Phil Heirigs, Chevron (Subgroup Chair) Paul Hodson/Oyvind Vessia, European Commission

E N D
August 2010 Interim ReportSubgroup 2:Issues Related to Co-Product CreditsPresented to the LCFS Expert Workgroup August 17, 2010Sacramento, CA 17-AUG-2010 INTERIM WORKING DRAFT FOR DISCUSSION WITH THE EWG -- DO NOT QUOTE OR CITE --
Subgroup 2 Membership • Alan Glabe, ARB Staff • Phil Heirigs, Chevron (Subgroup Chair) • Paul Hodson/Oyvind Vessia, European Commission • Stephen Kaffka, U.C. Davis • Don O’Connor, (S&T)2 • Mark Stowers, POET, Inc. 17-AUG-2010 INTERIM WORKING DRAFT FOR DISCUSSION WITH THE EWG -- DO NOT QUOTE OR CITE
Three Main Tasks were Outlined in the Scope of Work for this Subgroup • Task 1: Identify methodologies and inputs used to assess co-product impacts in ARB’s current carbon intensity estimates and those used in other researchers’ LCA modeling • Task 2: Identify, prioritize, and analyze issues related to co-product impacts that can be addressed in the short-term • Task 3: Identify, prioritize, and analyze issues related to co-product impacts that can be addressed in the long-term 17-AUG-2010 INTERIM WORKING DRAFT FOR DISCUSSION WITH THE EWG -- DO NOT QUOTE OR CITE
Task 1: Identify Methodologies and Inputs Used to Assess Co-Product Impacts in ARB’s Current Carbon Intensity Estimates and those Used in Other Researchers’ LCA Modeling • Work continues on compiling information on the treatment of co-products in various LCA evaluations. This is taking the form of a spreadsheet table that identifies the fuel pathway, co-products from that pathway, the co-product accounting method and assumptions, value of the credit, and the basis for the estimates. 17-AUG-2010 INTERIM WORKING DRAFT FOR DISCUSSION WITH THE EWG -- DO NOT QUOTE OR CITE
Accounting for Co-Products • Displacement/Substitution – In this method, co-products emissions are accounted for by estimating the emissions associated with a substitute product (e.g., excess electricity from sugarcane ethanol displaces electricity that would otherwise be generated for the grid). This results in a numerical credit that is subtracted from the total emissions of the pathway. • Allocation – In this method, emissions are allocated across all products of the process according to the mass, energy, or economic value of the products. This approach is often used when there is no clear product vs. co-product in a process (e.g., oil refining). 17-AUG-2010 INTERIM WORKING DRAFT FOR DISCUSSION WITH THE EWG -- DO NOT QUOTE OR CITE
Phil Heirigs Task 1 ProgressCo-Product Treatment in the LCFSDry Mill Corn Ethanol 17-AUG-2010 INTERIM WORKING DRAFT FOR DISCUSSION WITH THE EWG -- DO NOT QUOTE OR CITE
Phil Heirigs Task 1 ProgressCo-Product Treatment in the LCFSWet Mill Corn Ethanol 17-AUG-2010 INTERIM WORKING DRAFT FOR DISCUSSION WITH THE EWG -- DO NOT QUOTE OR CITE
Phil Heirigs Task 1 ProgressCo-Product Treatment in the LCFSSoy BiodieselSugarcane Ethanol 17-AUG-2010 INTERIM WORKING DRAFT FOR DISCUSSION WITH THE EWG -- DO NOT QUOTE OR CITE
Don O’Connor ISO 14044 Life Cycle Assessment: Requirements and Guidelines • Allocation procedures shall be uniformly applied to similar inputs and outputs of the system under consideration. • Wherever possible, allocation should be avoided by: > Dividing the unit process to be allocated into two or more sub-processes and collecting the input and output data related to these sub-processes, or > Expanding the product system to include the additional functions related to the co-products. 17-AUG-2010 INTERIM WORKING DRAFT FOR DISCUSSION WITH THE EWG -- DO NOT QUOTE OR CITE
Don O’Connor ISO 14044 Life Cycle Assessment: Requirements and Guidelines (Continued) • Where allocation cannot be avoided, the inputs and outputs of the system should be: > partitioned between its different products or functions in a way that reflects the underlying physical relationships between them (mass or energy). • Where physical relationships alone cannot be established or used as the basis for allocation, the inputs should be: > allocated between the products and functions in a way that reflects other relationships between them (economic). 17-AUG-2010 INTERIM WORKING DRAFT FOR DISCUSSION WITH THE EWG -- DO NOT QUOTE OR CITE
Don O’Connor Current Situation for Co-Product Accounting • Direct emissions are: > sometimes allocated by displacement (corn ethanol), > sometimes by mass (soybean biodiesel), > sometimes by energy value (soybean biodiesel), and > sometimes by process energy (gasoline and diesel fuel). • Indirect emissions are: > determined by displacement but some displacement is determined based on economics and not on physical displacement. • For compliance with ISO LCA Standards there should be more consistency in the approach taken. 17-AUG-2010 INTERIM WORKING DRAFT FOR DISCUSSION WITH THE EWG -- DO NOT QUOTE OR CITE
Steve Kaffka Brander et al., 2009. Consequential and attributional approaches to LCA: a guide to policy makers with specific reference to greenhouse gas LCA of biofuels. Econometrica Presswww.econometrica.co.uk “Allocation methods are required where a single process produces two or more products, and the emissions from the process need to be allocated between the outputs. ALCA allocates emissions by economic value, energy content or mass, whereas CLCA avoids allocation by using system expansion. System expansion involves identifying the products which are substituted by the co-products of the product studied; then quantifying the emissions associated with the substituted products; and deducting the results from the total for the multifunctional process. Identifying the correct products that are substituted by co-products can have a large impact on the results of consequential LCA. A recent CLCA for soybean meal reported 721 gCO2e/kg of soybean meal if palm oil is the marginal oil, or 344 gCO2e/kg of soybean meal if rape seed oil is the marginal oil (Dalgaard et al 2008). Identifying the correct marginal product is often dependent on the judgment of the LCA practitioner, and therefore reduces the certainty of the results.” Dalgaard, R., Schmidt, J., Halberg, N., Christensen, P., Thrane, M., and Pengue, W. A. “LCA of Soybean Meal”, Int. J. Life Cycle Anal. 13, (3), 2008, pp. 240 – 254. 17-AUG-2010 INTERIM WORKING DRAFT FOR DISCUSSION WITH THE EWG -- DO NOT QUOTE OR CITE
August 2010 Interim ReportSubgroup 2: Issues Related to Co-Product CreditsTask 2: Identify, Prioritize, and Analyze IssuesRelated to Co-Product Impacts that can beAddressed in the Short-Term 17-AUG-2010 INTERIM WORKING DRAFT FOR DISCUSSION WITH THE EWG -- DO NOT QUOTE OR CITE
Task 2: Identify, Prioritize, and Analyze Issues Related to Co-Product Impacts that can be Addressed in the Short-Term Work continues on the high priority issues identified in the work plan: • Diet substitution effects/displacement ratios for co-products used in animal feed: Meetings were held on June 30 and July 26 with a number of animal nutrition and feed experts. We are likely to hold one more meeting to wrap-up this issue. • Treatment of co-products in GTAP and GREET: In progress. • Co-product issues related to soy oil: Don O’Connor has prepared a summary of the issue. • Co-product treatment for other virgin oils: In progress; will be discussed during next meeting with feed experts. 17-AUG-2010 INTERIM WORKING DRAFT FOR DISCUSSION WITH THE EWG -- DO NOT QUOTE OR CITE
Diet Substitution Effects/Displacement Ratios • ARB’s analysis of dry mill corn ethanol utilizes a displacement/substitution approach to account for distiller’s grains and solubles (DGS) in which 1 lb. of DGS is assumed to displace 1 lb. of feed corn. • Research by other parties indicates that: > DGS typically displaces both feed corn and soybean meal (SBM) in animal rations (as well as other nutrition components). > For some animals (e.g., beef cattle), DGS may displace feed corn and SBM on a greater than 1:1 basis (by mass). > For example, the current version of Argonne’s GREET model assumes that 1 lb. of DGS displaces 0.947 lb. of feed corn, 0.303 lb. of SBM, and 0.025 lb. of urea (note that domestic vs. export displacement ratios were developed for GREET1.8d). • Because assumptions regarding displacement of feed corn and SBM by DGS impact both direct and indirect emissions estimates, this was identified as a high priority item by the Co-Products Subgroup. 17-AUG-2010 INTERIM WORKING DRAFT FOR DISCUSSION WITH THE EWG -- DO NOT QUOTE OR CITE
Animal Feed and Nutrition Invited ExpertsParticipating in the June 30/July 26 Meetings 17-AUG-2010 INTERIM WORKING DRAFT FOR DISCUSSION WITH THE EWG -- DO NOT QUOTE OR CITE
Summary of June 30, 2010Animal Feed and Nutrition Expert Meeting(UC Davis and via Conference Call) 17-AUG-2010 INTERIM WORKING DRAFT FOR DISCUSSION WITH THE EWG -- DO NOT QUOTE OR CITE
June 30 Animal Feed and Nutrition Expert MeetingFred Owens, Pioneer Hi-Bred International • High variability of DGS is a concern; feedlots want a material that is consistent as possible to prevent metabolic upsets in animals. • Waste management of phosphorus is a concern. Corn hybrids differ in phosphorus level, and therefore DGS differs in phosphorus level. • Nutritional value of DGS varies as a function of extent of fermentation (i.e., residual starch), amount of solubles added to DGS solids, and whether oil is removed during processing. • For swine, data indicate that particle size impacts digestibility; smaller particles = more efficient use of feed. 17-AUG-2010 INTERIM WORKING DRAFT FOR DISCUSSION WITH THE EWG -- DO NOT QUOTE OR CITE
June 30 Animal Feed and Nutrition Expert MeetingGalen Erickson, University of Nebraska - Lincoln • The UNL work shows that wet DGS is used more efficiently than dry DGS for inclusion rates ranging from 20% to 40% on a dry-matter basis. • Depending on inclusion rate (10 to 40%) and whether dry, modified, or wet, DGS displaced from 110% to 150% of corn in beef cattle diets on a dry matter basis. • For dairy cattle, 1 kg DGS replaces 0.45 kg corn and 0.55 kg SBM (from Schingoethe, 2008). • For finishing pigs, 1 kg of DGS replaces 0.57 kg corn and 0.43 kg SBM (from Stein, 2008). • The greatest displacement is for wet DGS fed to beef cattle (1.28 to 1.45 ratio). 17-AUG-2010 INTERIM WORKING DRAFT FOR DISCUSSION WITH THE EWG -- DO NOT QUOTE OR CITE
June 30 Animal Feed and Nutrition Expert MeetingKirk Klasing, UC Davis • Dr. Klasing presented information on non-ruminants (e.g., poultry and swine), as much of the discussion during the first meeting was centered on dairy and beef cattle. > These animals are late in “coming to the party” with respect to DGS use. > Use of DGS for poultry has come on strong in the past few years; most growers use about 10% DGS in poultry rations. > There has also been a large increase in the use of DGS in swine operations over the last two to three years. > However, young animals do not utilize DGS well, and DGS is typically used for finishing for poultry and swine. 17-AUG-2010 INTERIM WORKING DRAFT FOR DISCUSSION WITH THE EWG -- DO NOT QUOTE OR CITE
Summary of July 26, 2010Animal Feed and Nutrition Expert Meeting(UC Davis and via Conference Call) 17-AUG-2010 INTERIM WORKING DRAFT FOR DISCUSSION WITH THE EWG -- DO NOT QUOTE OR CITE
July 26 Animal Feed and Nutrition Expert MeetingJerry Shurson, University of Minnesota • Estimated DGS market share across animal types: dairy (42%), beef (38%), swine (14%), and poultry (6%). • Opportunity for increased DGS use for swine and poultry exists, particularly during periods of high grain prices. Economics, DGS supply, and research to develop solutions for overcoming nutritional barriers for increased DGS use will influence future market penetration of DGS. • Current DGS inclusion rates range from 10-20% for lactating diary cows, 20-40% for beef cattle, 10-40% for swine, and 5-30% for poultry. • Estimated displacement ratios: > Dairy = 1.364 (0.731 corn; 0.633 SBM) > Beef = 1.252 (1.196 corn; 0.056 urea) > Swine = 1.000 (0.669 corn; 0.295 SBM; + trace nutrients) > Poultry = 0.997 (0.589 corn; 0.446 SBM; + trace nutrients) > Overall Average = 1.249 (compares to 1.271 from 2008 GREET analysis) 17-AUG-2010 INTERIM WORKING DRAFT FOR DISCUSSION WITH THE EWG -- DO NOT QUOTE OR CITE
July 26 Animal Feed and Nutrition Expert MeetingMichael Wang, Argonne National Laboratory • Argonne first investigated co-product credits for DGS in the late-1990s. • Displacement ratios were updated in 2008, but they have since discovered that they need to update their 2008 estimates (paper in review). • Two aspects of co-product displacement ratios to consider: (1) the direct credit that can be calculated within GREET (more corn displaced = larger co-product credit); and (2) the impact on iLUC estimates because of the displacement effect (more SBM displaced = less of an indirect impact). • Dr. Wang noted that they are not feed experts, but they need co-product estimates for LCA purposes. • GREET is a bottom-up model, and they are still unsure if a bottom-up approach to feed co-products reflects the marketplace. Perhaps the way to get to a resolution of the issue is looking at both bottom-up and top-down methods. 17-AUG-2010 INTERIM WORKING DRAFT FOR DISCUSSION WITH THE EWG -- DO NOT QUOTE OR CITE
July 26 Animal Feed and Nutrition Expert MeetingMay Wu, Argonne National Laboratory • Dr. Wu discussed Argonne’s latest displacement ratio estimates: > Used data from board-invited reviews for beef (Klopfenstein, 2008), dairy (Schingoethe, 2009), and swine (Stein and Shurson, 2009), which covered a much broader range of studies than Argonne’s 2008 report. The inclusion rate and performance evaluation were based on recommendations from these reviews. > Swine – inclusion rate increased to 20%; same performance as conventional feed. > Dairy – remains 20% inclusion rate; no performance change based on the 2009 review by Dr. Schingoethe. > Beef – remains 20% and 40% inclusion rate for dry and wet DGS respectively; 1.313 displacement ratio. Slight change in numbers due to recalculated market share. > Added poultry – inclusion rate of 10%; displacement ratio similar to that used in Dr. Shurson’s analysis (~ 1). > Considered displacement of corn, SBM, and urea based on the above assumptions; did not consider phosphates. • They are still finding uncertainties in their estimates, especially in consumption reporting which is very inconsistent 17-AUG-2010 INTERIM WORKING DRAFT FOR DISCUSSION WITH THE EWG -- DO NOT QUOTE OR CITE
July 26 Animal Feed and Nutrition Expert MeetingPresentation by Don O’Connor, (S&T)2“Top-Down” Assessment of DGS Displacement Ratios 17-AUG-2010 INTERIM WORKING DRAFT FOR DISCUSSION WITH THE EWG -- DO NOT QUOTE OR CITE
Don O’Connor Top Down Approach to Displacement Ratios • In earlier EWG meetings, CARB emphasized the need for data to support alternative DDG displacement ratio. • USDA reports feed usage data but it excludes co-products from fuel ethanol. • Nevertheless the dataset is informative and can be adjusted to include ethanol co-products. 17-AUG-2010 INTERIM WORKING DRAFT FOR DISCUSSION WITH THE EWG -- DO NOT QUOTE OR CITE
Don O’Connor USDA Dataset Results 17-AUG-2010 INTERIM WORKING DRAFT FOR DISCUSSION WITH THE EWG -- DO NOT QUOTE OR CITE
Don O’Connor Data Set Issues • Two of the main issues with this dataset are: • DDG from fuel ethanol plants and co-products from wet milling fuel plants are not included, although co-products from wet milling plants producing food products are included. • Feed usage is not typically measured but it calculated from production and other measured disappearances. This means that there can be some year to year variability due to harvest timing. Each of the feedstuffs also has a slightly different starting point for the year. 17-AUG-2010 INTERIM WORKING DRAFT FOR DISCUSSION WITH THE EWG -- DO NOT QUOTE OR CITE
Don O’Connor Revised Dataset Results 17-AUG-2010 INTERIM WORKING DRAFT FOR DISCUSSION WITH THE EWG -- DO NOT QUOTE OR CITE
Don O’Connor Dataset Analysis • Using the revised dataset, a comparison of the three year average feed consumption in 1999-2002 (to reduce year to year variability in the feed estimates) to the most recent year of data (2009) can be made. • The 1999-2002 data was normalized to the same number of GCAU as the recent dataset (although there is very little increase in GCAU over this time period) and then the change in energy feeds and other low protein by-product feeds (mostly corn) and protein feeds (mostly soybean meal) was compared to the increase in DG use. 17-AUG-2010 INTERIM WORKING DRAFT FOR DISCUSSION WITH THE EWG -- DO NOT QUOTE OR CITE
Don O’Connor Results • The results were that for every unit of DG used, the energy feeds decreased by 1.12 units and the protein feeds decreased by 0.12 units, for a total reduction of 1.24 units of feed for every unit of DG consumed. • Generally consistent with other bottom up calculations with the exception that less SBM was displaced. 17-AUG-2010 INTERIM WORKING DRAFT FOR DISCUSSION WITH THE EWG -- DO NOT QUOTE OR CITE
Key Take-Aways from theJune 30 and July 26Animal Feed and Nutrition Expert Meetings 17-AUG-2010 INTERIM WORKING DRAFT FOR DISCUSSION WITH THE EWG -- DO NOT QUOTE OR CITE
Animal Feed and Nutrition Expert MeetingsKey Take-Aways... • With respect to displacement of animal feed by DGS: > Some animal species see an increase in feed efficiency when DGS is used and some do not. > For some species DGS will replace SBM as well as corn and in other species it will not. > For species that show an increase in feed efficiency (e.g., beef cattle), DGS primarily replaces corn. • Recent studies show DGS displacement ratios for dairy cattle are roughly 1:1 on a mass basis. This value impacts the overall displacement of feed corn and SBM by DGS. • High DGS inclusion rates may reduce efficiency in some animals because corn oil interferes with ruminant nutrition; some studies have shown a decrease in efficiency for lactating dairy cows at DGS inclusion rates above 8% - 10%. 17-AUG-2010 INTERIM WORKING DRAFT FOR DISCUSSION WITH THE EWG -- DO NOT QUOTE OR CITE
Animal Feed and Nutrition Expert MeetingsKey Take-Aways... (continued) • The forage diet used in conjunction with DGS should be accounted for in estimating impacts (e.g., corn stocks and other AG residue). • The ultimate mix of feed material depends on economics and is regionally specific: > California dairy rations may contain 15-20 ingredients. > Real-world feed rations are developed based on LP models that minimize cost, thus, it is difficult to extrapolate research studies to practice. > The feed industry is dynamic and highly dependent on prices of feed ingredients; feed mfrs will formulate on a weekly basis. Information on feed rations is not reported by feed mfrs, which makes it difficult to obtain real-world data. 17-AUG-2010 INTERIM WORKING DRAFT FOR DISCUSSION WITH THE EWG -- DO NOT QUOTE OR CITE
Animal Feed and Nutrition Expert MeetingsKey Take-Aways... (continued) • Inclusion rates for DGS could ultimately be constrained by elevated levels of nitrogen and phosphorus, which lead to manure management issues. • With respect to saturation of the U.S. DGS market: > Although saturation may become a regional issue, it is thought that DGS at the 15 BGY level can be absorbed into the U.S. feed market because it displaces soybean meal (SBM) and there is strong worldwide demand for SBM. > While the domestic market is important to address, the export market needs attention; we have much less understanding of DGS used in other countries. • An open question moving forward is whether the nutritional value of DGS (and corresponding displacement ratios) will change as corn hybrids are formulated to maximize ethanol yield. 17-AUG-2010 INTERIM WORKING DRAFT FOR DISCUSSION WITH THE EWG -- DO NOT QUOTE OR CITE
Animal Feed and Nutrition Expert MeetingsKey Take-Aways... (continued) • There remains a difference in opinion and concern among the animal feed and nutrition experts regarding the translation of research results on displacement values to the real world. • Among the issues that need to be addressed are: > How roughage is handled (and changed) when DGS is fed. > Whether DGS is fed wet or dry (note that Argonne has developed a dry vs. wet split). > How the protein source replaced by DGS is handled (e.g., urea, SBM, cottonseed meal, etc.). 17-AUG-2010 INTERIM WORKING DRAFT FOR DISCUSSION WITH THE EWG -- DO NOT QUOTE OR CITE
Steve Kaffka How to calculate GHG values for the LCFS? • By-product feeding is based on least-cost, ration balancing (optimization) models which integrate the use of diverse feeds based on species-specific nutritional objectives and price. Optimum solutions change constantly due to price, learning (formal research and industry trial and error) and other non-obvious localized constraints. Most rations for ruminants are optimized for energy density targets, secondarily for protein and other critical components. • This issue is especially complicated in CA, where numerous by-products are available and fed (> 15 commonly in dairy rations). Currently, for example, a large amount of canola meal is being used in CA. 17-AUG-2010 INTERIM WORKING DRAFT FOR DISCUSSION WITH THE EWG -- DO NOT QUOTE OR CITE
How to calculate GHG values for the LCFS? Steve Kaffka This means that the feeding value of a by-product feed depends on the feeding values of the other feeds used in the ration and the animal species, and is not absolute. Learning is involved. Actual performance is difficult to predict in high performing ruminant animals, perhaps less so in monogastric animals like poultry and swine. Substitution ratios are used in LCA to indicate the effect of using DDGS instead of corn and soybean meal in livestock rations. Currently, GREET uses a ratio of 1.27:1 for DDGS fed to beef and dairy cattle. Previously, this ratio was 1:1. 17-AUG-2010 INTERIM WORKING DRAFT FOR DISCUSSION WITH THE EWG -- DO NOT QUOTE OR CITE
Steve Kaffka Comparative Feeds/Feeding Values (NRC, 1989) DM: dry matter; TDN: total digestible nutrients; CP: crude protein; NEL : Net energy (lactation); NDF: neutral detergent fiber. 17-AUG-2010 INTERIM WORKING DRAFT FOR DISCUSSION WITH THE EWG -- DO NOT QUOTE OR CITE
Steve Kaffka As-fed Rations on California Dairies: High GroupsP.H. Robinson (An. Feed Sci. Tech., in press) 17-AUG-2010 INTERIM WORKING DRAFT FOR DISCUSSION WITH THE EWG -- DO NOT QUOTE OR CITE
Steve Kaffka As-fed Rations on California Dairies: High GroupsP.H. Robinson (An. Feed Sci. & Tech., in press) 17-AUG-2010 INTERIM WORKING DRAFT FOR DISCUSSION WITH THE EWG -- DO NOT QUOTE OR CITE *beet pulp + barley / ** linseed meal
How to calculate GHG values for the LCFS? Steve Kaffka From the perspective of ration balancing, there is no large substitution effect to be achieved. Rations with DDGS and without DDGS can be (and are) created to achieve the same livestock performance targets. But by-product feeds do displace purpose-grown feed crops. The proper questions are (1) how many acres of crops are displaced, and (2) what GHG savings can be attributed to that displacement? Given the dynamic nature of livestock feeding and the diversity of feed options available, this is also difficult to determine with certainty. Actual feed usage at the national scale provides one coarse approach to estimation. 17-AUG-2010 INTERIM WORKING DRAFT FOR DISCUSSION WITH THE EWG -- DO NOT QUOTE OR CITE
How to calculate GHG values for the LCFS? Steve Kaffka Substitution ratios are used in LCA to indicate the effect of using DDGS instead of corn and soybean meal in livestock rations. Currently, GREET uses a ratio of 1.27:1 for DDGS fed to beef and dairy cattle. Previously, this ratio was 1:1. In reality, the substitution depends on the ration used for comparison. Adding an energy rich feed to an energy deficient diet will appear to provide an increase in livestock performance (substitution ratio > 1.0), but if comparably optimized diets are compared, this ratio will remain essentially 1:1. 17-AUG-2010 INTERIM WORKING DRAFT FOR DISCUSSION WITH THE EWG -- DO NOT QUOTE OR CITE
How to calculate GHG values for the LCFS? Steve Kaffka The LCFS depends on the idea that GHG can be determined with sufficient certainty that a particular biofuel can be determined to reduce the GHG intensity of a transport fuel. In the area of by-product feeding, substitution ratios cannot be determined with finality or sufficient certainty. 17-AUG-2010 INTERIM WORKING DRAFT FOR DISCUSSION WITH THE EWG -- DO NOT QUOTE OR CITE
Issues Related to TranslatingDiet Substitution Effects/Displacement Ratiosinto GTAP Model Inputs 17-AUG-2010 INTERIM WORKING DRAFT FOR DISCUSSION WITH THE EWG -- DO NOT QUOTE OR CITE
GTAP Modeling ofDiet Substitution Effects/Displacement Ratios Don O’Connor Even if the physical displacement ratios can be determined there remains the issue of translating those into GTAP, which uses elasticity parameters to determine the substitution of DDG with corn and protein meals. The change in price of DDG determines the substitution rate for the competing feeds. DDG selling price is the price which matches the supply and demand. The value of DDG is different in the different market segments depending on what is being displaced. The price is set by the lowest value market segment. For the other market segments, value is transferred from the producer to the consumer. Therefore DDG price alone may not allow the model to determine what is physically displaced and thus provide the real changes in land demand. 17-AUG-2010 INTERIM WORKING DRAFT FOR DISCUSSION WITH THE EWG -- DO NOT QUOTE OR CITE
Issues Related to GTAP Modeling of Soy BiodieselPresentation by Don O’Connor, (S&T)2 17-AUG-2010 INTERIM WORKING DRAFT FOR DISCUSSION WITH THE EWG -- DO NOT QUOTE OR CITE
Don O’Connor Soybean Biodiesel Co-Products • The modeling that was done for soybean biodiesel has some fundamental economic issues. • The crush margin (value of the products less the cost of inputs) goes negative in the modelled scenario. Soybean meal price drops by 44%. • Soybean meal prices in linked economies are vastly different. 17-AUG-2010 INTERIM WORKING DRAFT FOR DISCUSSION WITH THE EWG -- DO NOT QUOTE OR CITE
Don O’Connor Crush Margins Negative crush margins are not possible in a sustainable environment. 17-AUG-2010 INTERIM WORKING DRAFT FOR DISCUSSION WITH THE EWG -- DO NOT QUOTE OR CITE
Don O’Connor Regional Variation • Soybean meal is traded internationally. • Price in various global centres differs by the transportation costs. 17-AUG-2010 INTERIM WORKING DRAFT FOR DISCUSSION WITH THE EWG -- DO NOT QUOTE OR CITE


![Food [feed and fiber] subgroup ARB Expert Workgroup on LCFS](https://cdn2.slideserve.com/4806566/food-feed-and-fiber-subgroup-arb-expert-workgroup-on-lcfs-dt.jpg)