Download
1 / 41
410 likes | 523 Views
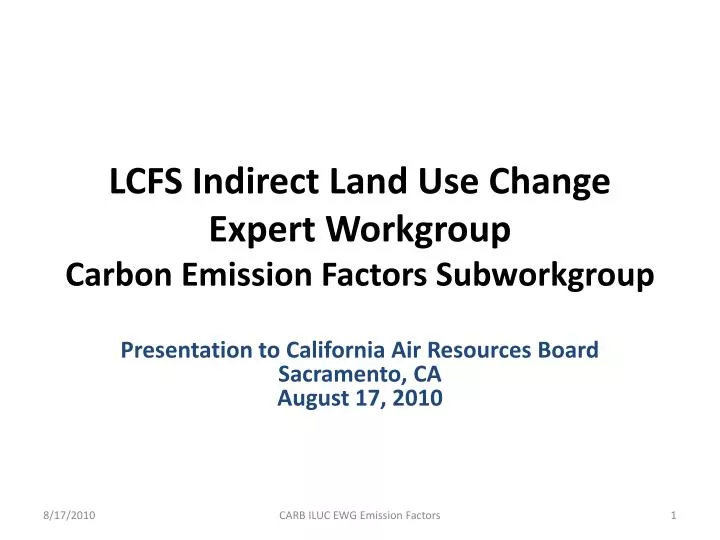
LCFS Indirect Land Use Change Expert Workgroup Carbon Emission Factors Subworkgroup. Presentation to California Air Resources Board Sacramento, CA August 17, 2010. Membership. Sonia Yeh (University of California, Davis) – Co-chair Richard Nelson (Kansas State University) – Co-chair

E N D
LCFS Indirect Land Use Change Expert WorkgroupCarbon Emission Factors Subworkgroup Presentation to California Air Resources BoardSacramento, CAAugust 17, 2010 CARB ILUC EWG Emission Factors
Membership • Sonia Yeh (University of California, Davis) – Co-chair • Richard Nelson (Kansas State University) – Co-chair • UweFritsche (Oeko-Institut, Germany) • Holly Gibbs (Stanford University) • Keith Kline (ORNL) • Steffen Mueller (University of Illinois at Chicago) • Don O’Connor (representing CDFA, S&T Consulting) • Michael O’Hare (University of California, Berkeley) • ARB staff representative: Kevin Cleary • Special thanks to: • SahokoYui, graduate student, UC Davis • Susan Tarka Sanchez, Lifecycle Associates • Richard Plevin, UC Berkeley LCFS Indirect Land Use Change Expert Workgroup July Update
Outline • Biomass C • Review • Pay attention to the issue of scale: Develop spatially explicit C stocks by AEZ • Soil C • Changes in Soil C Stock – depth, percent loss, management • Loss rates on conversion, including the specific time profile, including non-CO2 emissions • Emission factors for other indirect effects: livestock emissions, rice cultivation, and crop switching • Uncertainty Analysis • The list only includes what the subgroup is able to examine to date, and does not imply the exclusion of other important emission factors yet to be examined CARB ILUC EWG Emission Factors
Land conversion emissions • Above-ground biomass • Is land cover accurately categorized? • Is converted region same as average? • What is the time profile of emissions? • Below-ground biomass • Estimated using roots:shoots ratio • How much is affected by conversion? • Foregone sequestration • What would have been stored? • Over what time period? • Soil carbon • Varies spatially and with LU history • How much is affected by conversion? • What is time profile of emissions?
Generic Approach • Total Carbon stock change is the area times the change in carbon stock density. • Area is a GTAP output. • GTAP provides the change in forest area and pasture (livestock) area for each AEZ in each of the regions as shown in the next couple of slides.
Ideally carbon stock changes can be determined for each AEZ rather than using a country average as has been the practice to date. • This depends on having good carbon stock data at the AEZ level.
IPCC Tier 1 -- Default Values Gibbs et al. (2007) ERL, Ruesch and Gibbs (2008) Rough approximations that are immediately available CARB ILUC EWG Emission Factors
Extrapolate up using range of satellite data Forest Carbon “Tier 1.75” Saachi et al (2007) CARB ILUC EWG Emission Factors
Data Sources for Forest Carbon Stock Estimates in Winrock Analysis Ruesch and Gibbs (2008) CARB ILUC EWG Emission Factors
Range in C Stock Biome Estimates CARB ILUC EWG Emission Factors
Biomass C Stock • Evaluate the spatially-explicit Winrock database as a basis for estimating biomass C stock by AEZ • Holly Gibbs can provide data and assistance in the implementation • Supplement with databases to improve the accuracy of certain regions/eco-system types, or to include the consideration of certain factors (e.g. forest degradation) • Estimate the ranges of uncertainties (confidence interval) associated with these biomass C stock values according to the origins of the data or other methods (e.g default uncertainty values presented in the IPCC Guidelines) CARB ILUC EWG Emission Factors
Soil C Stock • Winrock analysis • World Harmonized Soil Database (2009) has a resolution of 1 km • Evaluate 30 cm depth (Winrock/IPCC) vs. 100 cm depth used on WHRC • Peatlands treated differently • Evaluate 20-50% soil C loss (Winrock) vs. 25% soil C loss (WHRC) for forest to cropland conversion • Evaluate management factors • For example: Full till practice and medium cultivation assumed for all croplands in Winrock • Coefficient of variation is 0.45 CARB ILUC EWG Emission Factors
Comparison of Soil C Loss in CARB/WHRC vs. Winrock Analysis (not weighted by land type converted) CARB ILUC EWG Emission Factors
IPCC Activity Data Stock Change Factors (20 yrs) (LULUCF) CARB ILUC EWG Emission Factors
Peatlands Emissions • Winrock • Represented in Indonesia and Malaysia, and cover 2-44% and 2-22% in some of the corresponding administrative regions. • Emission factors = 20 t C/ha/yr assuming 80 cm drainage depth • Constant emissions for 80 yrs (cumulative emissions = 1600 t C/ha) • Globally peatlands are net C sinks and net methane sources. • Winrock’s analysis concludes CH4 emissions from undisturbed tropical peatlands are small compared with C emissions after disturbance. Our analysis of boreal peatlands shows the same results. However, local conditions vary. CARB ILUC EWG Emission Factors
Peatlands Emissions – Fossil Fuel LU • Peatlands emissions from oil and oil sands extraction in Alberta available from Yeh et al. (ES&T, submitted) • ~22% of current oil sands surface leases is covered by peatland Soil carbon (in t C/ha) of peatland of continental western Canada (Alberta, Saskatchewan, and Manitoba). Extracted from Yeh et al. based on Tables 1 and 3 of Vitt et al. (2000) Source: Yeh, Sonia, Jordaan, Sarah, Brandt, Adam, Turetsky, Merritt, Spatari, Sabrina and Keith, David. Land Use Greenhouse Gas Emissions from Conventional and Unconventional Oil Production. ES&T, submitted. CARB ILUC EWG Emission Factors
Loss Rates on Conversion • Changes in BM C stock • Fire emissions (in the disturbed case and in the reference case) • Harvested wood products • Forest categories (disturbed vs undisturbed, by maturity status, by degradation status) • Drought? • Management practices? • Foregone Sequestration • Livestock emission factors • Other non Kyoto climate forcing-emissions • N2O emissions CARB ILUC EWG Emission Factors
Harvested Wood Products • Disposition of C in harvested wood products: products-in-use, landfill, emitted with energy capture, emitted without energy capture. • IPCC guidelines recommend default reporting of the removals from forest system as instantaneous emission to the atmosphere for UNFCCC reporting purposes • Other guidelines dealing with C sequestration of harvested wood products : IPCC, California Climate Action Registry (CCAR), DOE 1605 Forestry Emission Guidelines, Chicago Climate Exchange, etc. • Consider the storage factor and the fate of the C in the products • Example (Next slide) • Need to know the (dynamic) market share of these products in order to allocate emissions to various pools CARB ILUC EWG Emission Factors
Examples of C sequestration in forest products Source: Intergovernmental Panel on Climate Change (IPCC): 2003a, Estimation, reporting and accounting of harvested wood products – technical paper. UNFCCC paper FCCC/TP/2003/7,, UNFCCC Secretariat, Bonn, Germany October 27, 2003. http://unfccc.int/resource/docs/tp/tp0307.pdf. February 3, 2005. Source: DOE. Technical Guidelines for Voluntary Reporting of Greenhouse Gas Program. Appendix D. Summary of Data and Methods Contributing to Calculation of the Disposition of Carbon in Harvested Wood Products CARB ILUC EWG Emission Factors
Harvested Wood Products (HWP) in the US • USDA’s Resource Planning Act RPA tables • Used in LU spreadsheet appended to GREET 1.8d for US region HWP = Fraction of softwood/hardwood removal from harvested sites * Fraction of sawlogs/pulpwood production from softwood/hardwood * Disposition patterns for different time horizons
Emission Factors for other Indirect Effects • Increased demand leads to higher prices that lead to increased production and lower consumption. • Two areas where there may be significant GHG impacts of reduced consumption are: • Livestock emissions • Rice production emissions CARB ILUC EWG Emission Factors
Livestock Emissions • Ag emissions account for ~32% of total anthropogenic emissions. • Two major categories of livestock emissions • Enteric fermentation (~34% of total ag emissions) • Manure (~8% of total ag emissions) and indirect emissions from manure management highly variable and substantial CARB ILUC EWG Emission Factors
Livestock Emissions • Results from RFS2 CARB ILUC EWG Emission Factors
Livestock Emissions • Approach • Take the change in livestock population from GTAP. • Multiply by the livestock emissions per region. • Inventories are available for UNFCCC Annex 1 countries. • EPA has published estimates of emissions for 92 countries plus 8 regions. CARB ILUC EWG Emission Factors
Rice Emissions • Rice emissions account for 11% of ag emissions. • RFS2 Results CARB ILUC EWG Emission Factors
Rice Emissions • Same basic approach • Take the change in rice production from GTAP • Multiply by the rice emissions per GTAP region • UNFCCC and EPA inventories. CARB ILUC EWG Emission Factors
Crop Switching • GHG emissions per acre are significantly different between crops, rotation and management practices. CARB ILUC EWG Emission Factors
GHG emission intensities per unit area and per unit of dry matter (DM) for the 21 most important field crops in Canada during 2006 CARB ILUC EWG Emission Factors
Land Use After Conversion • For example: Factors by by Ogle et al. • Assess land use and management impacts on soil organic carbon storage for US agricultural lands • Factors represent the change in SOC storage for the top 30cm of the soil profile after 20 years following the management change. • Used in LU spreadsheet appended to GREET 1.8d
Crop Switching • Total GHG emissions from ag land therefore depend on the crop mix and field management practices. • Some of the crop shifting is driven by the availability of co-products. In the direct GHG analysis, we already attempted to put a GHG values on those co-products, so there is some overlaps between the GHG change from crop shifting and the GHG benefits from the direct analysis of co-products. CARB ILUC EWG Emission Factors
Summary of Emission Factors of Other Indirect Effects • There are other indirect impacts beyond changes in carbon stocks (biomass + Soil C). • The changes can be positive or negative. • For some pathways the other emissions are significant (~25% of ILUC for soybean biodiesel). CARB ILUC EWG Emission Factors
Climate-active emissions • Direct LLGHGs • CO2, CH4, N2O, halocarbons (SF6, CFCs, etc.) • Indirect GHGs • affect the fate of direct GHGs • CO, NOX, NMVOC • Aerosols: short-lived, vary regionally • organic carbon, SO2 (cooling) • black carbon (mainly warming)
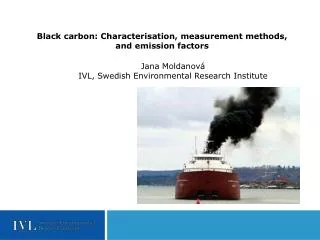
Black Carbon (soot) • Formed by incomplete combustion • Absorbs heat and reduces albedo (reflectance) • Short atmospheric lifetime (days or weeks) • 2nd largest contributor to GW after CO2 • Despite many uncertainties, it’s useful to include BC in uncertainty analysis
Emission factor for savanna fires a Delmas et al. 1995; b IPCC AR4; c Brakkee et al 2008; d Bond and Sun 2005; e Sanhueza 2009
Treatment of Uncertainties • Include confidence intervals in all estimates • Monte Carlo simulation can better represent the skewness of the overall distribution • Use parametric analysis to estimate emission of specific time profile to examine emissions over time • Include specific emission factors such as forest degradation factor, N2O emissions, N application rates, treatment of forest wood products, livestock emissions, inclusion/exclusion of non-CO2 GHG emissions (with uncertainty range) in the sensitivity analysis • Use global SA to estimate uncertainty importance to identify which parameters drive overall variance. CARB ILUC EWG Emission Factors
Next Step • Examine the following issues and identify recommendations for: • Changes in BM C stock • Fire emissions • Forest categories (disturbed vs undisturbed, maturity, degradation, drought) • Soil C emissions • Dynamic modeling of LU emission changes (stock + flow) vs. categorical modeling (percent changes in stock) CARB ILUC EWG Emission Factors


![Food [feed and fiber] subgroup ARB Expert Workgroup on LCFS](https://cdn2.slideserve.com/4806566/food-feed-and-fiber-subgroup-arb-expert-workgroup-on-lcfs-dt.jpg)