Download

1 / 49
490 likes | 614 Views
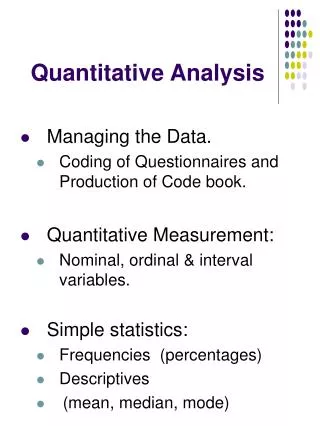
Ordinal data Analysis: Liability Threshold Models. Frühling Rijsdijk SGDP Centre, Institute of Psychiatry, King’s College London. Ordinal data. Measuring instrument discriminates between two or a few ordered categories e.g.: Absence (0) or presence (1) of a disorder

E N D
Ordinal data Analysis:Liability Threshold Models Frühling Rijsdijk SGDP Centre, Institute of Psychiatry, King’s College London
Ordinal data • Measuring instrument discriminates between two or a few ordered categories e.g.: • Absence (0) or presence (1) of a disorder • Score on a single Q item e.g. : 0 - 1, 0 - 4 • In such cases the data take the form of counts, i.e. the number of individuals within each category of response
Analysis of categorical (ordinal) variables • The session aims to show how we can estimate correlations from simple count data (with the ultimate goal to estimate h2, c2, e2) • For this we need to introduce the concept of ‘Liability’ or ‘liability threshold models’ • This is followed by a more mathematical description of the model
Liability • Liability is a theoretical construct. It’s the assumption • we make about the distribution of a variable which • we were only able to measure in terms of a few ordered • categories • Assumptions: • Categories reflect an imprecise measurement of an underlying normal distributionof liability • (2) The liability distribution has 1 or more thresholds (cut-offs) to discriminate between the categories
For disorders: Affected individuals The risk or liability to a disorder is normally distributed, only when a certain threshold is exceeded will someone have the disorder. Prevalence: proportion of affected individuals. For a single questionnaire item score e.g: 0 = not at all 1 = sometimes 2 = always 0 1 2 Does not make sense to talk about prevalence: we simply count the endorsements of each response category
68% -2 3 - 0 1 1 2 -3 The Standard Normal Distribution Liability is a latent variable, the scale is arbitrary, distribution is assumed to be a Standard Normal Distribution (SND) or z-distribution: • Mathematically described by the SN Probability Density function ( =phi), a bell-shaped curve with: • mean= 0 and SD = 1 • z-values are the number of SD away from the mean • Convenience: area under curve =1, translates directly to probabilities
Area=P(z zT) zT 3 -3 0 Standard Normal Cumulative Probability in right-hand tail (For negative z values, areas are found by symmetry)
Area=P(z zT) zT 3 -3 0 Standard Normal Cumulative Probability in right-hand tail (For negative z values, areas are found by symmetry)
Area=P(z zT) zT 3 -3 0 Standard Normal Cumulative Probability in right-hand tail (For negative z values, areas are found by symmetry) Z0 Area 0 .50 50% .2 .42 42% .4 .35 35% .6 .27 27% .8 .21 21% 1 .16 16% 1.2 .12 12% 1.4 .08 8% 1.6 .06 6% 1.8 .036 3.6% 2 .023 2.3% 2.2 .014 1.4% 2.4 .008 .8% 2.6 .005 .5% 2.8 .003 .3% 2.9 .002 .2%
.234 .6 1.8 3 -3 We can find the area between any two thresholds Area=P(.6 z 1.8) Z0 Area to the right .6 .27 (27 %) 1.8 .036 ( 3.6 %) - 27-3.6 = 23.4 % Ability to work out the areas under the curve (proportions) enables the reverse operation, e.g. find the z-value to describe proportion of affected individuals in a sample or proportion scoring e.g 0, 1, 2 on item.
From sample counts to z-value It is possible to find a z-value (threshold) so that the area exactly matches the observed proportion of the sample e.g. sample of 1000 individuals, where 80 have met the criteria for a disorder (8%): the z-value is 1.4 Z0 Area .6 .27 27% .8 .21 21% 1 .16 16% 1.2 .12 12% 1.4 .08 8% 1.6 .055 6% 1.8 .036 3.6% 2 .023 2.3% 2.2 .014 1.4% 2.4 .008 .8% 2.6 .005 .5% 2.8 .003 .3% 2.9 .002 .2% 1.4 3 -3 0 unaff aff Counts: 920 80
Twin1 Twin2 0 1 a b 0 d c 1 Two ordinal traits: Data from twins > Contingency Table with 4 observed cells: cell a: pairs concordant for unaffected cell d: pairs concordant for affected cell b/c: pairs discordant for the disorder 0 = unaffected 1 = affected
Joint Liability Model for twin pairs • Assumed to follow a bivariate normal distribution, where both traits have a mean of 0 and standard deviation of 1, but the correlation between them is variable. • The shape of a bivariate normal distribution is determined by the correlation between the traits r =.90 r =.00
Bivariate Normal (R=0.6) partitioned at threshold 1.4 (z-value) on both liabilities
Liab 2 0 1 Liab 1 .87 .05 0 .05 .03 1 Expected Proportions of the BN, for R=0.6, Th1=1.4, Th2=1.4
How are expected proportions calculated? By numerical integration of the bivariate normal over two dimensions: the liabilities for twin1 and twin2 e.g. the probability that both twins are affected : Φis the bivariate normal probability density function, L1andL2 are the liabilities of twin1 and twin2, with means0,andis the correlation matrix of the two liabilities T1is threshold (z-value) onL1,T2is threshold (z-value) onL2
Liab 2 0 1 Liab 1 00 01 0 10 11 1 How is this used to estimate correlations between two observed ordinal traits? Ability to work out the expected proportions given any correlation (shape of the BND) and set of thresholds on the liabilities, enables the reverse operation i.e. the sample proportions in the 4 cells of the CT (i.e. number of 00, 01,10 and 11 scoring pairs)are used to estimate the correlation between liabilities and the thresholds
Twin Models • Estimate correlation in liabilities separately for MZ and DZ pairs from their Count data • Variance decomposition (A, C, E) can be applied to the liability of the trait • Correlations in liability are determined by path model • Estimate of the heritability of the liability
Summary • To estimate correlations for ordinal traits (counts) we make assumptions about the joint distribution of the data (Bivariate Normal) • The relative proportions of observations in the cells of the Contingency Table are translated into proportions under the BN • The most likely thresholds and correlations are estimated • Genetic/Environmental variance components are estimated based on these correlations derived from MZ and DZ data
Variance constraint Threshold model ¯ ¯ Aff Aff ACE Liability Model 1 1/.5 E C A A C E L L 1 1 Unaf Unaf Twin 1 Twin 2
0 1 2 0 O1 O2 O3 1 O4 O5 O6 Test of BN assumption For a 2x2 CT with 1 estimated TH on each liability, the 2 statistic is always 0, 3 observed statistics, 3 param, df=0 (it is always possible to find a correlation and 2 TH to perfectly explain the proportions in each cell). No goodness of fit of thenormal distribution assumption. This problem is resolved if the CT is at least 2x3 (i.e. more than 2 categories on at least one liability) A significant 2 reflects departure from normality.
Fit function Raw Ordinal Data • The likelihood for a vector of observed ordinal responses is computed by the expected proportion in the corresponding cell of the MV distribution • The likelihood of the model is the sum of the likelihoods of all vectors of observation • This is a value that depends on the number of observations and isn’t very interpretable (as with continuous raw data analysis) • So we compare it with the LL of other models, or a saturated (correlation) model to get a 2 model-fit index • (Equations given in Mx manual, pg 89-90)
Raw Ordinal Data • ordinal ordinal • Zyg respons1 respons2 • 1 0 0 • 1 0 0 • 1 0 1 • 2 1 0 • 2 0 0 • 1 1 1 • 2 . 1 • 2 0 . • 2 0 1
Power issues • Ordinal data / Liability Threshold Model: less power than analyses on continuous data Neale, Eaves & Kendler 1994 • Solutions: 1. Bigger samples 2. Use more categories cases Sub-clinical group cases
Model-fitting to Raw Ordinal Data Practical
Sample and Measures • TEDS data collected at age 8 • Parent report • Childhood Asperger Syndrome Test (CAST) (Scott et al., 2002) • twin pairs: 1221 MZ 2198 DZ • Includes children with autism spectrum conditions
The CAST score dichotomized at 98% (i.e. Scores of >16), is the official cut-off point for children at risk for Autism Spectrum Disorder This resulted in only 16 concordant affected pairs (0 in some groups). Numbers improved using a cut-off point of 90% (however, clinically less interesting)
Practical Exercise CAST score dichotomized (0,1) at 90% > threshold (z-value) of around 1.28 Prevalence of boys (14%) Observed counts: MZMDZM 0 1 0 1 0 483 17 0 435 53 1 29 44 1 54 29 File: cast90m.dat R Script: UnivACE_MatrRawOrd.R Dir: fruhling/Ordinal Analyses/Binary
Cast90m.dat 1 0 0 2 0 0 1 0 0 1 0 1 2 0 0 2 0 . 2 0 0 1 0 0 2 0 0 2 0 0 2 1 0
# Program: UnivACE_MatrRawOrd.R require(OpenMx) source("GenEpiHelperFunctions.R") # Read data from REC ASCI text file (cast90m.dat) with '.' as missing values, space sep # Variabels: zyg cast90_tw1 cast90_tw2 # zyg: 1=mz, 2=dz (all males) allVars<- c('zyg', 'cast90_tw1' , 'cast90_tw2') Castdata <- read.table ('cast90m.dat', header=F, sep="", na.strings=".",col.names=allVars) nv <- 1 ntv <- nv*2 summary(Castdata) str(Castdata) Vars <-('cast90') selVars <- c('cast90_tw1' , 'cast90_tw2') mzData <- subset(Castdata, zyg==1, selVars) dzData <- subset(Castdata, zyg==2, selVars) # Print Descriptive Statistics summary(mzData) summary(dzData) table(mzData$cast90_tw1, mzData$cast90_tw2 ) table(dzData$cast90_tw1, dzData$cast90_tw2) # Program: UnivACE_MatrRawOrd_FR.R require(OpenMx) source("GenEpiHelperFunctions.R") # Read data from REC ASCI text file (cast90m.dat) with '.' as missing values, space seperated # Variabels: zyg cast90_tw1 cast90_tw2 # zyg: 1=mz, 2=dz (all males) allVars<- c('zyg', 'cast90_tw1' , 'cast90_tw2') Castdata <- read.table ('cast90m.dat', header=F, sep="", na.strings=".",col.names=allVars) nv <- 1 ntv <- nv*2 summary(Castdata) str(Castdata) Vars <-('cast90') selVars <- c('cast90_tw1' , 'cast90_tw2') mzData <- subset(Castdata, zyg==1, selVars) dzData <- subset(Castdata, zyg==2, selVars) # Print Descriptive Statistics # --------------------------------------------------------------------- summary(mzData) summary(dzData) table(mzData$cast90_tw1, mzData$cast90_tw2 ) table(dzData$cast90_tw1, dzData$cast90_tw2)
# Specify and Run Saturated Model (Tetrachoric correlations) # ----------------------------------------------------------------------- twinSatModel <- mxModel("twinSat", mxModel("MZ", # Matrix & Algebra for expected means, Thresholds and correlation mxMatrix( type="Zero", nrow=1, ncol=nv, name="M" ), mxAlgebra( expression= cbind(M,M), name="expMean" ), mxMatrix( type="Full", nrow=1, ncol=ntv, free=TRUE, values=.8, name="expThreMZ", dimnames=list('th1',selVars) ), mxMatrix(type="Stand", nrow=2, ncol=2, free=T, values=.5, lbound=-.99, ubound=.99, name="expCorMZ"), mxData(mzData, type="raw"), mxFIMLObjective( covariance="expCorMZ", means="expMean", thresholds="expThreMZ“, dimnames=selVars, )),
cast90_tw1 cast90_tw2 ThLiab1, ThLiab2 th1 # Specify and Run Saturated Model (Tetrachoric correlations) # ----------------------------------------------------------------------- twinSatModel <- mxModel("twinSat", mxModel("MZ", # Matrix & Algebra for expected means, Thresholds and correlation mxMatrix( type="Zero", nrow=1, ncol=nv, name="M" ), mxAlgebra( expression= cbind(M,M), name="expMean" ), mxMatrix( type="Full", nrow=1, ncol=ntv, free=TRUE, values=.8, name="expThreMZ", dimnames=list('th1',selVars) ), 0 0,0 z-values
L1 L2 L1 1 r L2 r 1 . . mxMatrix(type="Stand", nrow=2, ncol=2, free=T, values=.5, lbound=-.99, ubound=.99, name="expCorMZ"), . r 1 1 l1 l2 1 1 C1 C2
# Specify and Run Saturated Model (Tetrachoric correlations) # ----------------------------------------------------------------------- twinSatModel <- mxModel("twinSat", mxModel("MZ", # Matrix & Algebra for expected means, Thresholds and correlation mxMatrix( type="Zero", nrow=1, ncol=nv, name="M" ), mxAlgebra( expression= cbind(M,M), name="expMean" ), mxMatrix( type="Full", nrow=1, ncol=ntv, free=TRUE, values=.8, name="expThreMZ", dimnames=list('th1',selVars) ), mxMatrix(type="Stand", nrow=2, ncol=2, free=T, values=.5, lbound=-.99, ubound=.99, name="expCorMZ"), mxData(mzData, type="raw"), mxFIMLObjective( covariance="expCorMZ", means="expMean", thresholds="expThreMZ“, dimnames=selVars, )),
# Specify and Run Saturated Model (Tetrachoric correlations) # ----------------------------------------------------------------------- twinSatModel <- mxModel ("twinSat", mxModel("MZ", # Matrix & Algebra for expected means, Thresholds and correlation . . ), mxModel(“DZ", # Matrix & Algebra for expected means, Thresholds and correlation . . ), ) twinSatFit <- mxRun(twinSatModel) twinSatSumm <- summary(twinSatFit) twinSatSumm
# Specify and Run Saturated SubModel 1 equating Thresholds across Twin 1 and Twin 2 within zyg group # ----------------------------------------------------------------------- twinSatSub1 <- twinSatModel twinSatSub1$MZ$expThreMZ <- mxMatrix(type="Full", nrow=1, ncol=2, free=T, 0.8, label="threMZ", name="expThreMZ", dimnames=list('th1',selVars)) twinSatSub1$DZ$expThreDZ <- mxMatrix(type="Full", nrow=1, ncol=2, free=T, 0.8, label="threDZ", name="expThreDZ", dimnames=list('th1',selVars)) twinSatSub1Fit <- mxRun(twinSatSub1) twinSatSub1Summ <- summary(twinSatSub1Fit) twinSatSub1Summ cast90_tw1 cast90_tw2 threMZ, threMZ th1 # Specify and Run Saturated SubModel 1 equating Thresholds across Twin 1 # and Twin 2 within zyg group # ----------------------------------------------------------------------- twinSatSub1 <- twinSatModel twinSatSub1$MZ$expThreMZ <- mxMatrix(type="Full", nrow=1, ncol=2, free=T, 0.8, label="threMZ", name="expThreMZ", dimnames=list('th1',selVars)) twinSatSub1$DZ$expThreDZ <- mxMatrix(type="Full", nrow=1, ncol=2, free=T, 0.8, label="threDZ", name="expThreDZ", dimnames=list('th1',selVars)) twinSatSub1Fit <- mxRun(twinSatSub1) twinSatSub1Summ <- summary(twinSatSub1Fit) twinSatSub1Summ
# Fit ACE Model with RawData and Matrices Input, ONE overall Threshold # --------------------------------------------------------------------- univACEOrdModel <- mxModel("univACEOrd", mxModel("ACE", # Matrices a, c, and e to store a, c, and e path coefficients mxMatrix( type="Full", nrow=nv, ncol=nv, free=TRUE, values=.6, label="a11", name="a" ), mxMatrix( type="Full", nrow=nv, ncol=nv, free=TRUE, values=.6, label="c11", name="c" ), mxMatrix( type="Full", nrow=nv, ncol=nv, free=TRUE, values=.6, label="e11", name="e" ), # Matrices A, C, and E compute variance components mxAlgebra( expression=a %*% t(a), name="A" ), mxAlgebra( expression=c %*% t(c), name="C" ), mxAlgebra( expression=e %*% t(e), name="E" ), # Algebra to compute total variances and SD mxAlgebra( expression=A+C+E, name="V" ), mxMatrix( type="Iden", nrow=nv, ncol=nv, name="I"), mxAlgebra( expression=solve(sqrt(I*V)), name="sd"), # Constraint on variance of ordinal variables mxConstraint( alg1="V", "=", alg2="I", name="Var1"), E C A L 1 A + C + E =1
Illustration • Run script and check that the values in • the Table are correct. • What are the conclusions about the thresholds? • What is the final model in terms of the thresholds?
& Thresholds: MZM twin 1 =1.14, MZM twin 2 = 1.25 DZM twin 1 = 1.06, DZM twin 2 = 1.06 $ Thresholds: MZM =1.19, DZM = 1.06 Based on these results, the final TH model in the script is: 1TH for males: 1.11 The correlations for this model are: r MZM = 0.87 (.80-.93) r DZM = 0.45 (.29-.59)
Exercise • Add the ‘CE’sub-model, using the same logic as for the ‘AE’ sub-model • Note: In # Print Comparative Fit Statistics ----------------------------------------------------------------------- univOrdACENested <- list(univOrdAEFit, univOrdCEFit, univOrdEFit) tableFitStatistics(univOrdACEFit,univOrdACENested)
DF and Constraints OS 2288 ACE Model param NPAfterConstraint 2 1 NPBeforeConstraint a, c, e (3) thresholds (1) Number Of Constr 1 3 4 df OS - NPAC = 2288 – 3 =2285 OpenMx: OS + number of Constr - NPBC = 2289 – 4 = 2285
Multiple Thresholds:more than two categories For multiple threshold models, to ensure t1>t2>t3 etc....... We use a slightly more complicated model for the thresholds
Threshold Specification 2 Categories > 1 threshold per Liability Threshold Matrix : 1 x 2 T(1,1) T(1,2) threshold twin1 & twin2 T11 Threshold Model T / T12 t11 t12 Threshold twin 1 T11 Threshold twin 1 T12
3 Categories > 2 thresholds per liability Matrix T: 2 x 2 T(1,1) T(1,2) threshold 1 for twin1 & twin2 T(2,1) T(2,2) increment Increment: must be positive t21 Twin 1 -4 -3 T11= t11 T21= t11+ t21 t22 Twin 2 -4 -3 T12= t12 T22= t12+ t22
Use multiplication to ensure that second threshold is higher than first t21 T11= t11 T21= t11+ t21 t22 Expected Thresholds: L*T T12= t12 T22= t12+ t22 1 0 1 1 t11 t12 t21 t22 t11 t12 t11 + t21 t12 + t22 = * Thresholds twin 2 T12 T22 Thresholds twin 1 T11 T21
nth <- 2 # number of thresholds thRows <- paste("th",1:nth,sep="") # thRows <- c('th1','th2') . . mxMatrix( type="Full", nrow=nth, ncol=ntv, free=TRUE, values=.5, lbound= c(-3, 0.0001, -3, 0.0001), name="Thmz" ), mxMatrix( type="Lower", nrow=nth, ncol=nth, free=FALSE, values=1, name="Inc" ), mxAlgebra( expression= Inc %*% Thmz, dimnames=list(thRows,selVars), name="expThmz"), t11 t12 t21 t22 t11 t12 t11 + t21 t12 + t22 1 0 1 1 = * expThmz
Note • This script will work if all variables have all ordered categories in the right order: e.g. 1 2 3 4 or 0 1 2 3 • If that is not true, e.g. you have a variable with possible categories 1-6, but no one has scored 3 and 6 • Or if you have a categorical variable with 4 possible scores 1 4 9 16, openMx will treat it as continuous. • This can all be done internally