Download
1 / 41
410 likes | 535 Views
MnDOT County Roadway Safety Plans Review Meeting 1. Metro June 21, 2012. Agenda. Introductions Safety Planning Process Data Overview Counties Combined Safety Emphasis Areas Safety Strategies Workshop Logistics Date, location Sample agenda, invitation, invite list Safety Strategies

E N D
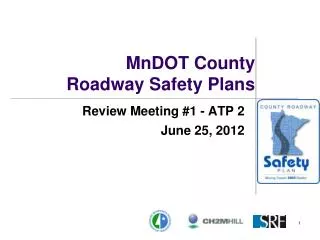
MnDOT County Roadway Safety PlansReview Meeting 1 Metro June 21, 2012
Agenda • Introductions • Safety Planning Process • Data Overview • Counties Combined • Safety Emphasis Areas • Safety Strategies Workshop • Logistics • Date, location • Sample agenda, invitation, invite list • Safety Strategies • Overview of Safety Project Development Process 6/21/2012
Project Approach – Phase IV June 2012 April 2012 April 2012 July 2012 Develop Comprehensive List of Safety Strategies Crash Analysis Select Safety Emphasis Areas Safety Workshop June 2012 Kick-off Meeting Review Mtg w/ Counties Project Programming Project Development Implementation Evaluation Refinement & Update SHSP Oct 2012 Identify Short List of Critical Strategies Identify Safety Projects Nov 2012 Sept 2012 January 2013 Safety Plan 6/21/2012
Metro* County Severe Crash Numbers Anoka Legend 10/yr (50 total) - Severe crashes on any jurisdiction 4/yr (20 total) - Severe crashes on CSAH/CR MnCMAT Crash Data, 2007-2011 Severe = K (fatal) + A (life-changing injury) * Anoka, Carver, Dakota, Ramsey, Scott and Washington Counties 80/yr (402) 37/yr (184) Washington 39/yr (197) 12/yr (60) Ramsey 105/yr (527) 42/yr (209) Carver 22/yr (108) 10/yr (51) Scott Dakota 32/yr (161) 19/yr (94) 78/yr (390) 36/yr (182) 6/21/2012
Metro* – Safety Emphasis Areas 6/21/2012
Anoka/Ramsey Emphasis Areas 6/21/2012
Carver/Scott Emphasis Areas 6/21/2012
Dakota/Washington Emphasis Areas 6/21/2012
Emphasis Areas 6/21/2012
Metro* County Crash Data Overview Source: MnCMAT Crash Data, 2007-2011 Severe is fatal and serious injury crashes (K+A). *Anoka, Carver, Dakota, Ramsey, Scott and Washington Counties 5 Year Crashes Metro ATP 210,586 2,876 Example All – % Severe – % CSAH/CR 65,672 – 31% 1,187 – 41% State System 83,531 – 40% 877 – 31% City, Twnshp, Other 61,383 – 29% 812 – 28% Urban 62,926 – 96% 1,042 – 88% Rural 2,692 – 4% 141 – 12% Int 781 – 72% 92 – 66% Signal 560 – 72% 53 – 58% Ped 1,078 – 43% 139 – 63% Bike 1,430 – 57% 80 – 37% Int 1,124 – 79% 55 – 69% Signal 702 – 62% 32 – 58% Not Animal 2,196 – 82% 135 – 96% Animal 495 – 18% 6 – 4% Non Ped/Bike 60,402 – 96% 823 – 79% Ped/Bike 2,508 – 4% 219 – 21% Unknown/Other 204 – 9% 5 – 4% Inters-Related 874 – 40% 51 – 38% Not Inters-Related 1,118 – 51% 79 – 59% Unknown/Other 8,256 – 14% 76 – 9% Not Inters-Related 15,084 – 25% 255 – 31% Inters-Related 37,058 – 61% 492 – 60% Other/Unknown 241 – 28% 18 – 35% Signalized 85 – 10% 1 – 2% All Way Stop 38 – 4% 2 – 4% Thru-Stop 510 – 58% 30 – 59% Run Off Road – 2,184 (15%), 76 (30%) Rear End – 5,407 (36%), 53 (21%) Head On – 1,054 (7%), 51 (20%) Right Angle – 1,521 (10%), 19 (7%) Right Angle – 177 (35%), 13 (43%) • Head On/SS Opp – 50 (10%), 5 (17%) Run Off Road – 53 (10%), 4 (13%) Signalized 22,807 – 62% 243 – 49% All Way Stop 1,332 – 4% 19 – 4% Thru-Stop 7,149 – 19% 138 – 28% Other/Unknown 5,764 – 16% 92 – 19% Run Off Road – 81 (34%), 5 (28%) • Right Angle – 25 (10%), 3 (17%) Head On/SS Opp – 15 (6%), 2 (11%) Head On, SS Opp 90 – 8% 14 – 18% Run off Road 689 – 62% 50 – 63% Right Angle – 6,332 (28%), 126 (52%) Rear End – 8,472 (37%), 42 (17%) Left Turn – 3,122 (14%), 21 (9%) Head On – 810 (4%), 17 (7%) Right Angle – 3,033 (42%), 76 (55%) Rear End – 1,689 (24%), 11 (8%) • Head On – 206 (3%), 11 (8%) Left Turn – 735 (10%), 9 (7%) On Curve 32 – 36% 4 – 29% On Curve 320 – 46% 30 – 60% 6/21/2012
Dakota/Washington County Crash Data Overview 5 Year Crashes Dakota/Washington 35,427 574 Example All – % Severe – % CSAH/CR 10,976 – 31% 234 – 41% State System 14,674 – 41% 202 – 35% City, Twnshp, Other 9,597 – 27% 138 – 24% Urban 9,824 – 90% 191 – 82% Rural 1,152 – 10% 43 – 18% Int 40 – 73% 9 – 90% Signal 24 – 60% 4 – 44% Ped 55 – 24% 10 – 40% Bike 177 – 76% 15 – 60% Int 154 – 87% 7 – 47% Signal 90 – 58% 2 – 29% Not Animal 870 – 76% 40 – 93% Animal 282 – 24% 3 – 7% Non Ped/Bike 9,590 – 98% 166 – 87% Ped/Bike 232 – 82% 25 – 13% Unknown/Other 63 – 7% 1 – 3% Inters-Related 322 – 37% 18 – 45% Not Inters-Related 485 – 56% 21 – 53% Unknown/Other 739 – 8% 8 – 5% Not Inters-Related 2,269 – 24% 50 – 30% Inters-Related 6,582 – 69% 108 – 65% Other/Unknown 91 – 28% 9 – 50% Signalized 22 – 7% 0 – 0% All Way Stop 10 – 3% 0 – 0% Thru-Stop 199 – 62% 9 – 50% Run Off Road – 419 (18%), 20 (40%) Rear End – 809 (36%), 11 (22%) Head On – 169 (7%), 10 (20%) Right Angle – 68 (%), 5 (%) Run Off Road – 17 (%), 2 (%) Signalized 3,764 – 57% 43 – 40% All Way Stop 397 – 6% 4 – 4% Thru-Stop 1,547 – 24% 42 – 39% Other/Unknown 873 – 13% 19 – 18% Run Off Road – 32 (35%), 2 (22%) Rear End – 18 (20%), 1 (11%) Right Angle – 11 (12%), 1 (11%) Head On, SS Opp 42 – 9% 8 – 38% Run off Road 308 – 64% 12 – 57% Right Angle – 781 (21%), 23 (53%) Rear End – 1,822 (48%), 9 (21%) Left Turn – 392 (10%), 4 (9%) Head On – 109 (3%), 4 (9%) Right Angle – 599 (39%), 20 (48%) • “Other” – 117 (8%), 7 (17%) Rear End – 204 (13%), 3 (7%) Left Turn – 161 (10%), 3 (7%) On Curve 11 – 26% 1 – 13% On Curve 115 – 37% 5 – 42% Source: MnCMAT Crash Data, 2007-2011 -- Severe is fatal and serious injury crashes (K+A).
Anoka/Ramsey County Crash Data Overview 5 Year Crashes Anoka/Ramsey 69,342 920 Example All – % Severe – % CSAH/CR 24,056 – 35% 392 – 43% State System 28,504 – 41% 310 – 34% City, Twnshp, Other 16,782 – 24% 218 – 24% Urban 23,795 – 99% 372 – 95% Rural 207 – 1% 16 – 4% Int 265 – 68% 30 – 58% Signal 172 – 65% 15 – 50% Ped 390 – 46% 52 – 65% Bike 452 – 54% 28 – 35% Int 359 – 79% 22 – 79% Signal 216 – 60% 14 – 64% Not Animal 189 – 91% 16 – 100% Animal 18 – 9% 0 – 0% Non Ped/Bike 22,948 – 96% 292 – 78% Ped/Bike 842 – 4% 80 – 22% Unknown/Other 15 – 8% 0 – 0% Inters-Related 68 –36% 3 – 19% Not Inters-Related 106 – 56% 13 – 81% Unknown/Other 1,541 – 7% 18 – 6% Not Inters-Related 6,075 – 26% 92 – 32% Inters-Related 15,330 – 67% 182 – 62% Other/Unknown 21 – 31% 1 – 33% Signalized 3 – 4% 0 – 0% All Way Stop 11 – 16% 1 – 33% Thru-Stop 33 – 49% 1 – 33% Run Off Road – 785 (13%), 24 (26%) Rear End – 2,163 (36%), 20 (22%) Head On – 404 (7%), 16 (17%) Right Angle – 715 (12%), 10 (11%) Left Turn – 242 (4%), 9 (10%) Run Off Road – 5 (15%), 1 (100%) Right Angle – 12 (36%), 0 (0%) Rear End – 6 (18%), 0 (0%) Signalized 9,330 – 61% 91 – 50% All Way Stop 670 – 4% 12 – 7% Thru-Stop 2,840 – 19% 39 – 21% Other/Unknown 2,488 – 16% 40 – 22% Head On, SS Opp 11 – 10% 2 – 15% Run off Road 43 – 41% 5 – 38% Right Angle – 2,647 (28%), 47 (52%) Rear End – 3,200 (34%), 18 (20%) Left Turn – 1,641 (18%), 11 (12%) Head On – 314 (3%), 5 (5%) Right Angle – 1,250 (%), 20 (51%) Rear End – 679 (%), 6 (15%) Head On – 71 (%), 4 (10%) Run Off Road – 73 (%), 3 (8%) On Curve 8 – 73% 1 – 50% On Curve 29 – 67% 4 – 80% Source: MnCMAT Crash Data, 2007-2011 -- Severe is fatal and serious injury crashes (K+A).
Carver/Scott County Crash Data Overview 5 Year Crashes Scott/Carver 10,599 258 Example All – % Severe – % CSAH/CR 3,631 – 34% 141 – 55% State System 4,917 – 46% 79 – 31% City, Twnshp, Other 2,051 – 19% 38 – 15% Urban 2,520 – 69% 66 – 47% Rural 1,111 – 31% 75 – 53% Int 12 – 80% 4 – 80% Signal 2 – 17% 1 – 25% Ped 15 – 29% 5 – 56% Bike 36 – 71% 4 – 44% Int 33 – 92% 3 – 75% Signal 15 – 45% 2 – 67% Not Animal 944 – 85% 72 – 96% Animal 166 – 15% 3 – 4% Non Ped/Bike 2,469 – 98% 57 – 86% Ped/Bike 51 – 2% 9 – 14% Unknown/Other 117 – 12% 4 – 6% Inters-Related 350 – 37% 26 – 36% Not Inters-Related 477 – 51% 42 – 58% Unknown/Other 173 – 7% 2 – 4% Not Inters-Related 748 – 30% 20 – 35% Inters-Related 1,548 – 63% 35 – 61% Other/Unknown 102 – 29% 7 – 27% Signalized 24 – 7% 0 – 0% All Way Stop 10 – 3% 1 – 4% Thru-Stop 214 – 61% 18 – 69% Run Off Road – 181 (24%), 9 (45%) • Head On – 61 (8%), 4 (20%) Rear End – 238 (32%), 3 (15%) Right Angle – 59 (8%), 3 (15%) Right Angle – 72 (34%), 7 (39%) Head On/SS Opp– 22 (10%), 4 (22%) Signalized 757 – 49% 6 – 17% All Way Stop 58 – 4% 1 – 3% Thru-Stop 443 – 29% 20 – 57% Other/Unknown 290 – 19% 8 – 23% Run Off Road – 41 (40%), 3 (43%) • Right Angle – 8 (8%), 2 (29%) Head On/SS Opp – 9 (9%), 1 (14%) Head On, SS Opp 33 – 7% 4 – 10% Run off Road 320 – 67% 31 – 74% Right Angle – 140 (18%), 4 (67%) Rear End – 374 (49%), 1 (17%) Head On – 37 (5%), 1 (17%) Right Angle – 182 (41%), 11 (55%) Left Turn – 44 (10%), 3 (15%) Head On – 19 (4%), 2 (10%) On Curve 12 – 36% 2 – 50% On Curve 170 – 53% 19 – 61% Source: MnCMAT Crash Data, 2007-2011 -- Severe is fatal and serious injury crashes (K+A).
Data Gathering Information as of 6/15/2012 Please respond to Ann’s request ASAP. 6/21/2012
Rural vs. Urban Segments Dakota Co DRAFT Anoka Co Carver Co Ramsey Co DRAFT Scott Co DRAFT Washington Co 6/21/2012
Safety Workshop Schedule County Engineer/Assistant County Engineer XX – Main Contact for County XX – Workshop Coordinator 6/21/2012
Safety Workshop – County Assignments • June • Group Coordinator - Secure Location and Caterer • 50-100 people • $12/person (“all in” including delivery, tax and tip) • Send invites (example will be provided) • July • Group Coordinator - Confirm final headcount (10 days prior to workshop) • Group Coordinator - Email Carla Stueve (SRF) cstueve@srfconsulting.com • Confirm Audio-visual availability for the workshop 6/21/2012
Safety Workshop Objective: Multidisciplinary discussion of a short list of safety strategies (Note: there is no discussion of specific locations.) • Date/Time: Various • Location: Various • Agenda • 8:30 – Coffee and Registration • 9:00 – Introductions • 9:10 – County Safety Reviews • 9:30 – Law Enforcement • 9:50 – Local Safety Advocate • 10:00 – Background Information/Desired Outcomes • 10:30 – Breakout Sessions – Prioritize Strategies • 12PM – 1PM - Lunch • 2:15 – Report Back/Final Presentation • 2:45 – 3PM - Wrap-up 6/21/2012
Sample List of Attendees: Law Enforcement State patrol, sheriffs and police chiefs EMS Providers Ambulance, first responders and emergency room staff Politicians County board members, city council members, state representatives Local Agency Staff County engineers, city engineers, county health representatives Tribal Representatives Safe Communities Folks Judges and Attorneys Advocacy Groups MADD, AARP, Bicycle, Safe Routes to School MnDOTStaff Safety Workshop 6/21/2012
Target Crash Types 6/21/2012
Screening - Initial Strategies AASHTO’s SHSP, NCHRP Report 500 Implementation Guidelines, and input from Safety Partners. The strategies will be screened using: - Crash data, - Effectiveness, - Cost, and - Input from Safety Workshop. The selected Critical Strategies should have the greatest potential to significantly reduce the number of traffic fatalities in your County. Distracted 2 Strategies Motorcycle 6 Strategies Ped/Bike 29 Strategies Intersections 30 Strategies Road Departure 8 Strategies Rear End 7 Strategies Young Drivers 2 Strategies Seat Belts 3 Strategies Alcohol/Drug 9 Strategies Workshop’s Critical Strategies Enforcement Strategies Education Strategies Engineering Strategies EMS Strategies 6/21/2012
Safety Strategies Overview NCHRP Report 500 A series of guides to assist state and local agencies in reducing injuries and fatalities in targeted emphasis areas The guides correspond to the emphasis areas outlined in the AASHTO Strategic Highway Safety Plan. Each guide includes a brief introduction, a general description of the problem, the strategies/ countermeasures to address the problem, and a model implementation process. 6/21/2012
Example – Typical Intersection Strategies Included Strategies: Change Intersection Type Dynamic Warning Signs Street Lighting Directional Median Enhanced Signing and Delineation 6/21/2012
List of Rear End Crashes Strategies 6/21/2012
List of Pedestrian Strategies 6/21/2012
List of Bicycle Strategies 6/21/2012
Example – Pedestrian/Bicycle Strategies Countdown Timers and Advanced Pedestrian Intervals Curb Extensions and Medians 6/21/2012
List of Road Departure Strategies 6/21/2012
List of Young Driver Strategies 6/21/2012
List of Motorcycle Strategies 6/21/2012
List of Distracted Driving 6/21/2012
List of Impaired Driving Strategies 6/21/2012
Project Development Process - Example 207 signalized intersections identified for Red-Light Confirmation Lights Right-Angle Crashes at Signals Highest Voting Results for Red-Light Confirmation Lights 6/21/2012
Urban County- Workshop Voting Results 6/21/2012
Urban County Project Summary 6/21/2012
What’s Next • Counties • Review, edit/concur with segment and intersection descriptions. • Continue assembling information about previous deployment of safety strategies; shoulder rumble strips, 6” edgelines, street lights, chevrons, etc. • Review, Edit/Concur with Emphasis Areas, Target Crash Types and Safety Strategies • Secure Location for Workshops • Secure Caterer • Finalize Invitation and Invite List • Decide/Secure Local Safety Advocate – Presenter • Workshops • Anoka/Ramsey – July 30th • Carver/Scott – August 1st • Dakota/Washington – August 9th 6/21/2012
More Information Questions? • Mn/DOT State Aid website • www.dot.state.mn.us/stateaid • Otter Tail County Safety Plan • http://www.dot.state.mn.us/stateaid/sa_county_traffic_safety_plans.html • Contact Information • Howard Preston, CH2M HILL, 651.365.8514, howard.preston@ch2m.com • Nikki Farrington, CH2M HILL, 651.365.8536, nicole.farrington@ch2m.com • Mike Marti, SRF Consulting Group, 763.249.6779, mmarti@srfconsulting.com • Carla Stueve, SRF Consulting Group, 765.249.6797, cstueve@srfconsulting.com • Renae Kuehl, SRF Consulting Group, 765.249.6783, rkuehl@srfconsulting.com • Ann Johnson, P.E. Services, 612.275.8190, johns421@umn.edu 6/21/2012