Download
1 / 1
30 likes | 265 Views
The combined Simple Biosphere/Carnegie-Ames-Stanford Approach (SiBCASA) Model Kevin Schaefer 1 , G. James Collatz 2 , Pieter Tans 3 , A. Scott Denning 4 , Ian Baker 4 , Joe Berry 5 , Lara Prihodko 3 , Neil Suits 4 , Andrew Philpott 4

E N D
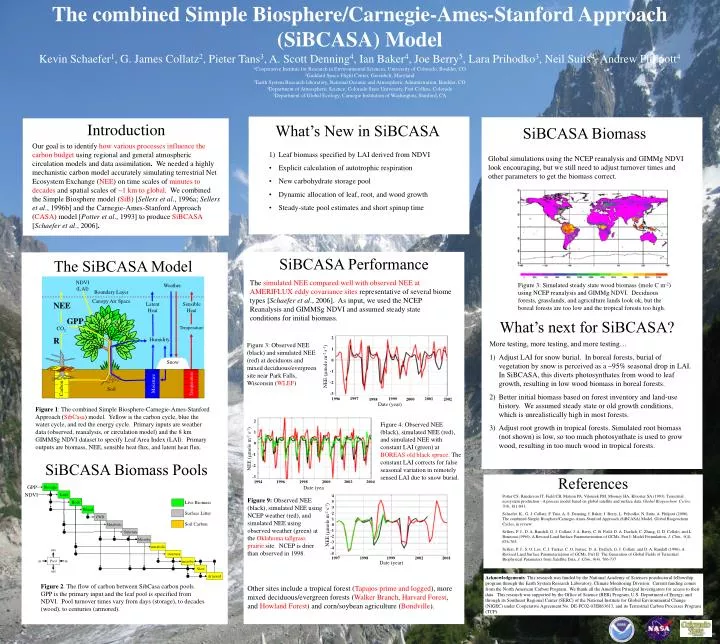
The combined Simple Biosphere/Carnegie-Ames-Stanford Approach (SiBCASA) Model Kevin Schaefer1, G. James Collatz2, Pieter Tans3, A. Scott Denning4, Ian Baker4, Joe Berry5, Lara Prihodko3, Neil Suits4, Andrew Philpott4 1Cooperative Institute for Research in Environmental Sciences, University of Colorado, Boulder, CO 2Goddard Space Flight Center, Greenbelt, Maryland 3Earth System Research laboratory, National Oceanic and Atmospheric Administration, Boulder, CO 4Department of Atmospheric Science, Colorado State University, Fort Collins, Colorado 5Department of Global Ecology, Carnegie Institution of Washington, Stanford, CA out Live Biomass Pool in in Leaf Surface Litter Root out Soil Carbon Wood metabolic sturcture Slow Metabolic Microbe Structure Storage 2 1 0 NEE (mmole m-2 s-1) -1 Armored -2 -3 1997 1996 1999 2001 2000 2002 1998 Date (year) 2 1 0 NEE (mmole m-2 s-1) -1 -2 -3 1994 1996 1998 2000 2002 2004 Date (year) 4 5 microbe 3 2 1 NEE (mmole m-2 s-1) 0 -1 -2 -3 -4 -5 1997 1998 1999 2002 2001 Date (year) Introduction What’s New in SiBCASA SiBCASA Biomass Our goal is to identify how various processes influence the carbon budget using regional and general atmospheric circulation models and data assimilation. We needed a highly mechanistic carbon model accurately simulating terrestrial Net Ecosystem Exchange (NEE)on time scales of minutes to decades and spatial scales of ~1 km to global. We combined the Simple Biosphere model (SiB) [Sellers et al., 1996a; Sellers et al., 1996b] and the Carnegie-Ames-Stanford Approach (CASA) model [Potter et al., 1993] to produce SiBCASA [Schaefer et al., 2006]. • Leaf biomass specified by LAI derived from NDVI • Explicit calculation of autotrophic respiration • New carbohydrate storage pool • Dynamic allocation of leaf, root, and wood growth • Steady-state pool estimates and short spinup time Global simulations using the NCEP reanalysis and GIMMg NDVIlook encouraging, but we still need to adjust turnover times and other parameters to get the biomass correct. NEE = Respiration – GPP SiBCASA Performance The SiBCASA Model The simulated NEE compared well withobserved NEEatAMERIFLUXeddy covariancesites representative of several biome types [Schaefer et al., 2006]. As input, we used the NCEP Reanalysis and GIMMSg NDVI and assumed steady state conditions for initial biomass. NDVI (LAI) Figure 3: Simulated steady state wood biomass (mole C m-2) using NCEP reanalysis and GIMMg NDVI. Deciduous forests, grasslands, and agriculture lands look ok, but the boreal forests are too low and the tropical forests too high. Weather Boundary Layer Canopy Air Space NEE Latent Heat Sensible Heat GPP What’s next for SiBCASA? Canopy Temperature CO2 R Humidity • More testing, more testing, and more testing… • Adjust LAI for snow burial. In boreal forests, burial of vegetation by snow is perceived as a ~95% seasonal drop in LAI. In SiBCASA, this diverts photosynthates from wood to leaf growth, resulting in low wood biomass in boreal forests. • Better initial biomass based on forest inventory and land-use history. We assumed steady state or old growth conditions, which is unrealistically high in most forests. • Adjust root growth in tropical forests. Simulated root biomass (not shown) is low, so too much photosynthate is used to grow wood, resulting in too much wood in tropical forests. Figure 3: Observed NEE (black) and simulated NEE (red) at deciduous and mixed deciduous/evergreen site near Park Falls, Wisconsin (WLEF) Snow Moisture Temperature Carbon Soil Figure 1: The combined Simple Biosphere-Carnegie-Ames-Stanford Approach (SibCasa) model. Yellow is the carbon cycle, blue the water cycle, and red the energy cycle. Primary inputs are weather data (observed, reanalysis, or circulation model) and the 8 km GIMMSg NDVI dataset to specify Leaf Area Index (LAI). Primary outputs are biomass, NEE, sensible heat flux, and latent heat flux. Figure 4: Observed NEE (black), simulated NEE (red), and simulated NEE with constant LAI (green) at BOREAS old black spruce.The constant LAIcorrects for false seasonal variation in remotely sensed LAI due to snow burial. SiBCASA Biomass Pools References GPP NDVI Potter CS, Randerson JT, Field CB, Matson PA, Vitousek PM, Mooney HA, Klooster SA (1993), Terrestrial ecosystem production - A process model based on global satellite and surface data, Global Biogeochem. Cycles, 7(4), 811-841. Schaefer, K., G. J. Collatz, P. Tans, A. S. Denning, I. Baker, J. Berry, L. Prihodko, N. Suits, A. Philpott (2006), The combined Simple Biosphere/Carnegie-Ames-Stanford Approach (SiBCASA) Model, Global Biogeochem. Cycles, in review. Sellers, P. J., D. A. Randall, G. J. Collatz, J. A. Berry, C. B. Field, D. A. Dazlich, C. Zhang, G. D. Collelo, and L. Bounoua (1996), A Revised Land Surface Parameterization of GCMs, Part I: Model Formulation, J. Clim., 9(4), 676-705. Sellers, P. J., S. O. Los, C. J. Tucker, C. O. Justice, D. A. Dazlich, G. J. Collatz, and D. A. Randall (1996), A Revised Land Surface Parameterization of GCMs, Part II: The Generation of Global Fields of Terrestrial Biophysical Parameters from Satellite Data, J. Clim., 9(4), 706-737 Figure 9: Observed NEE (black), simulated NEE using NCEP weather (red), and simulated NEE using observed weather (green) at the Oklahoma tallgrass prairie site. NCEP is drier than observed in 1998. CWD Acknowledgements: This research was funded by the National Academy of Sciences postdoctoral fellowship program through the Earth System Research Laboratory, Climate Monitoring Division. Current funding comes from the North American Carbon Program. We thank all the Ameriflux Principal Investigators for access to their data. This research was supported by the Office of Science (BER) Program, U.S. Department of Energy, and through its Southeast Regional Center (SERC) of the National Institute for Global Environmental Change (NIGEC) under Cooperative Agreement No. DE-FC02-03ER63613, and its Terrestrial Carbon Processes Program (TCP). Figure 2. The flow of carbon between SibCasa carbon pools. GPP is the primary input and the leaf pool is specified from NDVI. Pool turnover times vary from days (storage), to decades (wood), to centuries (armored). Other sites include a tropical forest (Tapajos prime and logged), more mixed deciduous/evergreen forests (Walker Branch, Harvard Forest, and Howland Forest) and corn/soybean agriculture (Bondville).