Download

1 / 19
190 likes | 349 Views
Hidden Markov Models. Chris Holmes Professor of Biostatistics University of Oxford. Overview. Hidden Markov models (HMMs) are perhaps the most important models currently in use today in Bioinformatics Applications include

E N D
Hidden Markov Models Chris Holmes Professor of Biostatistics University of Oxford
Overview • Hidden Markov models (HMMs) are perhaps the most important models currently in use today in Bioinformatics • Applications include • Gene finding; sequence alignment; detecting copy-number-variation; assessing evidence and impact of recombination; RNA structure prediction; etc • HMMs are a generic (graphical) modelling approach to analysing linear sequences; originally developed in the field of signal processing (and speech recognition in particular) • Highly computationally efficient – good news when working in genomics
Objectives • To gain an understanding of Hidden Markov models (HMMs) and their potential and applications in Bioinformatics • To understand how HMMs can be fit to data • We begin with some illustrative examples….
Copy-Number-Variation (CNV) • CNVs refer to segments of DNA found in varying numbers in the genome due to regions of duplication and deletion • Various technologies can be used to detect the amount of genomic DNA, such that deletions show up as reduced signal and duplications as increased signal
Hidden states • The defining feature is that the object of interest, the CNV state (deletion/normal/duplication), is unobserved • We wish to make inference on the unobserved sequence given the observed signal intensities • Moreover, we expect a persistence in the state; such that regions of duplication or deletion span multiple observations • …..Consider the following simple example……
The occasionally dishonest casino • Suppose a casino typically uses a fair die, but every now and then switches to using one that biases to throwing 6s • What we observe is the score from successive throws, but what we would like to make inferences about is when the casino is being dishonest • We suppose that the true underlying state is unobserved • If the underlying states (honest, dishonest) evolve in a Markov fashion and the observed variables depend only on the underlying state in a simple probabilistic fashion the system is referred to as a hidden Markov model • Note that the observed variables are not Markov 5 3 1 5 3 4 6 5 6 3 2 6 6 2 1 2 4 3 2 5 3 2 2 6 H H H H H H D D D D D D D H H H H H H H H H H H
The naïve approach • We want to calculate the likelihood of the data • The simple approach is to sum over all possible underlying states. Suppose I’d just seen the variables 1,6,4 Transition probabilities and ‘emission’ probabilities p(A) = Probability of starting in state A q(AB) = Probability of transition from state A to state B
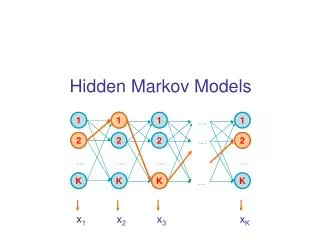
Dynamic programming • If I have x possible underlying states at each point and l points, there are xl possible paths. This number rapidly gets unworkable. • However, we can use a simple recursion to sum over all paths that requires only order xl operations • This is due to a method known as dynamic programming • The trick is to pretend we know how to calculate the likelihood conditional on being in state j at the ith position • The likelihood conditional on being in state k at the i+1th position is the sum over all states (j) at position i of the conditional likelihood multiplied by the probability of going from state j to state k multiplied by the probability of observing the data at position i+1 given state k
Xi+1 Emission probabilities = ek(Xi+1) H H D Transition probabilities = qij
Finishing the algorithm • The total likelihood for a sequence of length l is • The algorithm that works from left to right along the sequence is called the forward algorithm • There is an equivalent algorithm, called the backwards algorithm, that works from right to left • The algorithms are initialised by setting f(0) = b(L) = 1 and q0j = pj ,qj0 = 1
Why does it work? • The dynamic programming algorithms exploit the ‘conditional independence’ inherent in the model structure • This can be most clearly seen through graphical representations of models Linear models Branching models Target state Conditionally independent state Conditionally dependent states
Using the likelihood functions • We can use the likelihood function to estimate parameters and test hypotheses • HMMs are a special case of missing data problems, where the underlying ‘hidden’ states are the missing data • The EM algorithm can be used to estimate parameters by maximum likelihood • Another common use of HMMs is to make statements about the missing data • What is the most probable sequence of the underlying state? • What is the probability that the underlying state at position i is k?
The Viterbi algorithm • An algorithm very similar to the forward algorithm can be used to give the most likely sequence of hidden states (the maximum likelihood sequence): the Viterbi algorithm • Again, the trick is to say that we know the ML path up to position i that ends in state j (for all j). The ML path ending in state k at position i+1 is just the maximum over the paths ending in state j at position i multiplied by the transition probabilities • A traceback matrix keeps track of which is the most likely path • Again, the ML path can be found from
Xi-1 Xi Xi+1 H H H D D D
In practice 5 3 1 5 3 4 6 5 6 3 2 6 6 2 1 2 4 3 2 5 3 2 2 6 eH(1) = eH(2) = eH(3) = eH(4) = eH(5) = eH(6) = 1/6 eD(1) = eD(2) = eD(3) = eD(4) = eD(5) = 1/9 eD(6) = 4/9 qDH = qHD = 0.1 pH = pD = 0.5 Most likely path 5 3 1 5 3 4 6 5 6 3 2 6 6 2 1 2 4 3 2 5 3 2 2 6 H H H H H H H H H H H H H H H H H H H H H H H H But contribution of ML path to total likelihood = = 0.07
Posterior probabilities • Instead of asking what the most likely path is, we can ask about the probability that the hidden chain had a particular state, k, at a particular step, i • To do this we need to calculate the likelihood associated with all paths that go through state k at i, and normalise by the total likelihood Paths in likelihood Paths in conditional likelihood
Calculating posterior probabilities • To calculate this conditional probability we can make use of the two quantities we have already calculated using the forward and backward algorithms • The path made from selecting the states with the highest posterior probability (marginally) is called the maximum accuracy path 5 3 1 5 3 4 6 5 6 3 2 6 6 2 1 2 4 3 2 5 3 2 2 6 P(Honest) Truth H H H H H H D D D D D D D H H H H H H H H H H H Maximum accuracy path H H H H H H D D D D D DD H H H H H H H H H H H
Applications of HMMs • Bioinformatics • Gene finding • Gene annotation • RNA structure prediction • Aligning divergent sequences • Modelling genetic variation • Inferring genealogical histories • Automated speech recognition • ‘Segmenting’ noisy measurements
Acknowledgements • Professor Gil McVean for help with slides; Chris Yau for practical