Download

1 / 9
110 likes | 200 Views
Hidden Markov Models. Sean Callen Joel Henningsen. Example. Discovering average yearly temperature at a particular location on Earth over a series of years using observed size of tree growth rings. Possible states (hidden) – Hot (H) and Cold (C)

E N D
Hidden Markov Models Sean Callen Joel Henningsen
Example Discovering average yearly temperature at a particular location on Earth over a series of years using observed size of tree growth rings. Possible states (hidden) – Hot (H) and Cold (C) Possible observations – Small (S), Medium (M), and Large (L)
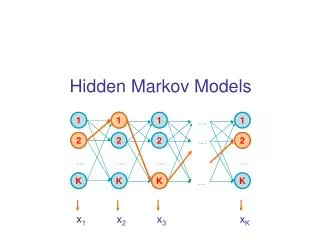
Notation T = length of the observation sequence N = number of states in the model M = number of observation symbols Q = {q0, q1, …, qN-1} = distinct states of the Markov process V = {0, 1, …, M-1} = set of possible observations A = state transition probability matrix B = observation probability matrix π = initial state sequence O = (O0, O1, …, OT-1) = observation sequence
Example’s Notation T = 4 N = 2 M = 3 Q = {H, C} V = {0, 1, 2}, (0=S, 1=M, 2=L) A = B = π= O = (0, 1, 0, 2)
The three problems • Given the model, find the probability of an observation sequence. • Given the model and an observation sequence, find the optimal state sequence. • Given an observation model, N, and M, determine a model to maximize the probability of O.
Problem 1 Finding the probability of an observation sequence. 1. Let α0(i) = πibi(O0) for i = 0, 1, ..., N - 1 2. For t = 0, 1, ..., T - 1 and i = 0, 1, ..., N - 1; compute: αt(i) = [Σ (αt-1(j) * aji) for j = 0 to j = N - 1] * bi(Ot) 3. P(O) = Σ (αT-1(i)) for i = 0 to i = N - 1 Example: For O = (0, 1, 0, 2), P(O) = .0096296 An observation sequence of small, medium, small, large has a probability of .96296%.
Problem 2 Finding the probability of a state sequence given an observation sequence. X = {x0, x1, x2, x3} O = (O0, O1, O2, O3) P(X) = πx0bx0(O0)ax0,x1bx1(O1)ax1,x2bx2(O2)ax2,x3bx3(O3) Let O = (0, 1, 0, 2) P(HHCC) = .6(.1)(.7)(.4)(.3)(.7)(.6)(.1) = .000212
Finding the optimal state sequence. Problem 2 To find the optimal state sequence, find the probability of having each element in each position by summing the normalized probabilities of states containing that element in that position. The optimal state sequence is contains the most probable element in each position.
Problem 3 Given an observation sequence O and dimensions N and M, find an improved model, (A, B, π). Initialize, λ = (A, B, π). Compute αt(i), βt(i), γt(i, j) and γt(i). Re-estimate the model λ = (A, B, π). If P(O | λ) increases, goto 2.