Download
1 / 18
190 likes | 375 Views
Molecular imaging and metabolite profiling of tissues sections by FTICR-MS MALDI and LESA. C. Logan Mackay Richard Goodwin SIRCAMS DMPK School of Chemistry R&D University of Edinburgh AstraZeneca Edinburgh Södertälje UK Sweden. MS Imaging - Small molecules. Aim.

E N D
Molecular imaging and metabolite profiling of tissues sections by FTICR-MS MALDI and LESA C. Logan Mackay Richard Goodwin SIRCAMS DMPK School of Chemistry R&D University of Edinburgh AstraZeneca Edinburgh Södertälje UK Sweden
MS Imaging - Small molecules Aim Molecular imaging - unlabelled Problem Metabolites missing Solution LESA profiling Summary
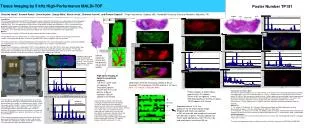
Ultraflex eXtreme Ultraflex IISynapt G2 12T FT-ICR-MSLESA TOF/TOFTOF/TOFLiquid extraction surface analysis Raclopride (a dopamine D2 receptor antagonist) C15H20Cl2N2O3 [M+H] m/z 347.0924 Organs: Brain Liver Kidney Whole body Dose: 7.5 2 mg/kg Time: 1 5 30 m.a.d Matrix:α-Cyano-4-hydroxycinnamic acid Application: solvent free dry matrix “Qualitative and quantitative MALDI imaging of the positron emission tomography ligands raclopride (a D2 dopamine antagonist) and SCH 23390 (a D1 dopamine antagonist) in rat brain tissue sections using a solvent-free dry matrix application method.” Anal. Chem. 15;83(24):9694-9701 Goodwin RJ, Mackay CL, Nilsson A, Harrison DJ, Farde L, Andren PE, Iverson SL (2011)
Raclopride 2 mg/kg 1 min post i.v Synapt MS Synapt MS/MS Synapt MS/MS MALDI MS imaging analysis of neurological positron emission tomography (PET) ligands: application to both established and developmental compoundsTue: 2.20pm
1 minute after dose 1 mg/kg 14C Quantitative Whole Body Autoradiography (QWBA) MS imaging Stomach Liver Heart Spinal cord Brain FT-ICR MS 350 µm
14C Quantitative Whole Body Autoradiography (QWBA) Raclopride 2 mg/kg Raclopride 2 mg/kg 1 5 30 min Vehicle 1 min post i.v 10.9 ± 0.6 nmol/g Cortex 12.9 ± 0.3 nmol/g 30 min post i.v 100 % 1.7 ± 0.1 nmol/g Cortex 5.4 ± 0.2 nmol/g Relative abundance 15% after 30 Relative abundance 40% after 30
MS Imaging Raclopride 2 mg/kg 1 min post i.v 10.9 ± 0.6 nmol/g 30 min post i.v • Conclusion • Linear response between dose and detection by MSI • In brain - correlation between MSI relative abundance and autoradiography abundance but not in kidney and liver 100 % 1.7 ± 0.1 nmol/g Relative abundance 15% after 30
30 minute after dose 2 mg/kg Plasma 30 m.a.d. Raclopride M4 M1 m/z 381 M2 m/z 523 M3 m/z 409 M4 m/z 333 Raclopride m/z 347 Unable to detect any metabolites by MALDI MSI M1 M2 M3
30 minute after dose 2 mg/kg Plasma 30 m.a.d. Raclopride M4 M1 m/z 381 M2 m/z 523 M3 m/z 409 M4 m/z 333 Raclopride m/z 347 Unable to detect any metabolites by MALDI MSI M1 M2 M3 LESA Liquid Extraction Surface Analysis
700 nL MeOH/H2O (0.1 formic) Quad isolation (m/z 400 ± 175)
Measured Theoretical 30 minute after dose Raclopride 2 mg/kg Contribution to QWBA abundance
Measured m/z 381.0111 m/z 381.0794 Measured isotope distribution Theoretical m/z 381.0518 Theoretical isotope distribution Contribution to QWBA abundance
Measured Theoretical 30 minute after dose Raclopride 2 mg/kg
Measured m/z 526.1246 Measured isotope distribution Theoretical m/z 526.1245 Theoretical isotope distribution
S.D 56% N = 7 S.D 7% 30 minute after dose Raclopride 2 mg/kg
QWBA 30 minute after dose Raclopride 2 mg/kg MSIm/z 347 Dissected kidney 30 minute after dose raclopride 2 mg/kg
Summary Whole body Fast ESILESAprofiling Tissue specific Cheap Relative distribution MALDI MS imaging Study Absolute Quant. QWBA Effective Label available Time scale & Scope of analysis
Acknowledgments University of Edinburgh (SIRCAMS) Pat Langridge-Smith - Oral - Tue 9:10 (Room 118-120) David Clarke - Oral – Wed 9:30 (Exhibit hall A) Andrew Dennison - Oral – Tue 3:30 (Ballroom CD) Uppsala University Per Andren Anna Nilsson - Oral – Tue 2:50 (Ballroom B) AstraZenecaAdvion Suzanne Iverson Mark Allen (UK) Goran Eklund Mark Baumert (UK) Daniel Borg