Download
1 / 17
170 likes | 240 Views
Louis-Nicolas CARRIL MURTA. Supervisor : Eric Chassignet. Outline. Motivation ARGO float system HYCOM Data and model outputs Comparison Conclusion. Motivation. Aim? To evaluate the performance of the global HYCOM ocean prediction system

E N D
Louis-Nicolas CARRIL MURTA Supervisor: Eric Chassignet
Outline • Motivation • ARGO float system • HYCOM • Data and model outputs • Comparison • Conclusion
Motivation • Aim? • To evaluate the performance of the global HYCOM ocean prediction system • To improve the global HYCOM ocean prediction system
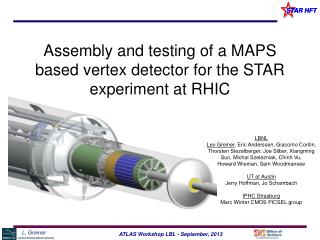
ARGO’s float system • Origin : WOCE 1990-1997 • Data transmitted by satellite • Hydraulic system to descend till 2000m depth • Provide a global quantitative ocean variability, salinity, temperature, velocity with profiles • Used for model validation
Float’s distribution Lack of floats
HYCOM Ocean Prediction System (HYbrid Coordinate Ocean Model) • Hybrid model: combine 3 vertical discretizations • z-level in unstratified regions like the mixed layer • Density coordinates in stratified regions • Terrain-following coordinates in coastal regions • Solve oceanic physical processes • Global 1/12° horizontal resolution • Forced by NOGAPS, assimilation of observed T, S, SSH • Hindcast runs: velocities, temperature, salinity
ARGO data & HYCOM outputs • HYCOM outputs : • Velocity, salinity and temperature : • From 2004 to 2007 • Daily outputs • Global 1/12° curvilinear grid • ARGO data : • Salinity & temperature : • From 2004 to 2007 • Daily data • Profiles (scattered data) • Velocity • Mean from 1997 to 2007 • 3°X3° rectilinear grid
HYCOM ARGO psu 37 SALINITY SALINITY 36 35 34 33 32 °C 30 TEMPERATURE TEMPERATURE 25 20 15 10 5 0 SURFACE TEMPERATURE AND SALINITY (2004-2007)
Surface U Velocity HYCOM ARGO 1997-2007 average 2004-2007 average -5 -10 -15 -20 20 15 10 5 0 cm/s
Comparison • Global differences: • Average of 2004 to 2007 • Seasonal average • Correlation (SST only): • Monthly average linear regression
2004-2007 (ARGO-HYCOM) °C & psu 2 Surface Surface SALINITY TEMP 1.5 1 0.5 0 1000m 1000m TEMP SALINITY -0.5 -1 -1.5 -2
Seasonal SST (ARGO-HYCOM) Summer Fall Spring Winter °C
Coefficient of Linear Regression a~ -1 HYCOM & ARGO opposite relationship a ~ 0 No correlation a~ 1 HYCOM & ARGO correlated
Conclusion • HYCOM global configuration provides a good approximation of mean salinity, temperature and velocity for long time periods • But HYCOM appears to not accurately capture the monthly variations
1000 m U Velocity HYCOM ARGO 1997-2007 average 2004-2007 average cm/s
Salinity HYCOM ARGO Parking pressure 1000m psu
Temperature HYCOM ARGO Parking pressure 1000m °C