Download
1 / 33
330 likes | 461 Views
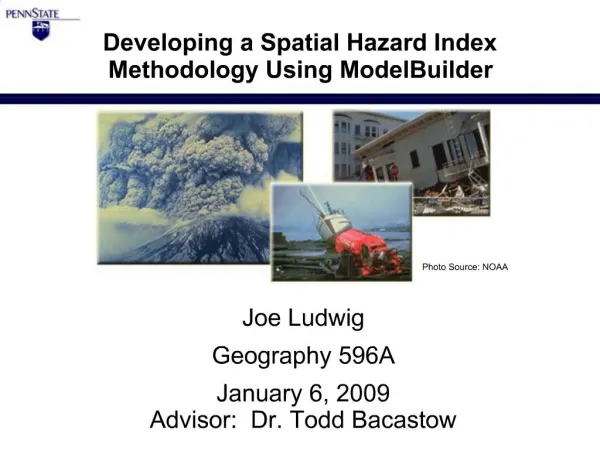
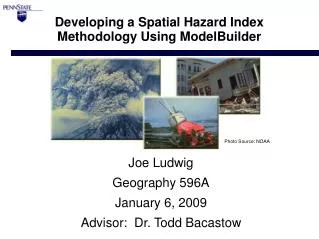
Creation of a hazard index : Overview of the Hotspots methodology. Piet Buys pbuys@worldbank.org. Project Objectives. Identification of natural disaster risk hotspots at sub-national scales Initial focus: Drought, floods, tropical cyclones, earthquakes, volcanoes, landslides

E N D
Creation of a hazard index:Overview of the Hotspots methodology Piet Buys pbuys@worldbank.org 5Th EM-DAT Technical Advisory Group Meeting
Project Objectives • Identification of natural disaster risk hotspots at sub-national scales • Initial focus: • Drought, floods, tropical cyclones, earthquakes, volcanoes, landslides • Where do they occur? • Where might damage be most severe (mortality and economic) 5Th EM-DAT Technical Advisory Group Meeting
Project Objectives • Prioritization for local vulnerability assessments and risk reduction in highest-risk areas • Support Bank efforts to engage clients in hazard management activities (Turkey Earthquake Insurance, CAS, ...) 5Th EM-DAT Technical Advisory Group Meeting
Ingredients for Disaster Hotspots Identification Hazard information / event probabilities at a given location, including probable magnitude, duration, timing Elements at risk people, infrastructure and economic activities/assets that would be affected if the hazard occurred Vulnerability of the elements at risk how damaged they would be, if they experienced a hazard event of some level 5Th EM-DAT Technical Advisory Group Meeting
Hazard Hazardousness Parameter Period Resolution Source(s) Storms Frequency by wind strength 1980-2000 30” UNEP/GRID-Geneva PreView, DECRG processing Drought Precipitation less than 75% of median for a 3+-month period (WASP) 1980-2000 2.5° IRI Climate Data Library Floods Counts of extreme flood events 1985-2003* 1° Dartmouth Flood Obs. World Atlas of Large Flood Events Earthquake Expected PGA (10% prob. of exceedance in 50 years) n/a sampled at 1’ Global Seismic Hazard Program Freq. of earthquakes > 4.5 on Richter Scale 1976-2002 sampled at 2.5’ Smithsonian Institution Volcanoes Counts of volcanic activity 79-2000 Sampled at 2.5’ UNEP/GRID-Geneva and NGDC Landslides Estimated annual prob. of landslide or avalanche n/a 30” Norwegian Geotechnical Institute Global Hazard Data 5Th EM-DAT Technical Advisory Group Meeting
Exposure Parameter Period Resolution Source(s) Land Land area 2000 2.5” GPW Version 3 (beta) Population Population counts / density 2000 2.5” GPW Version 3 (beta) Economic Activity National / subnational GDP 2000 2.5” World Bank DECRG Agricultural Activity National agricultural GDP allocated to agricultural land area 2000 2.5” IFPRI Road Density Length of major roads and railroads c. 1993 2.5” VMAP(0) Global Data on Elements at Risk 5Th EM-DAT Technical Advisory Group Meeting
Global Data on elements at risk • Focused on two in this study • Population / mortality (shown below) • GDP per unit area / economic losses (not shown) 5Th EM-DAT Technical Advisory Group Meeting
Global Data on Vulnerability of the Elements at Risk • Vulnerability estimates guided by past events • EM-DAT has records ofmortality, persons affectedand direct economic damage • http://www.em-dat.net/ • epidemiological approach based on mortality rate (extension to economic loss is straightforward) 5Th EM-DAT Technical Advisory Group Meeting
Mortality rates • compute mortality rates using EM-DAT cumulative number of persons killed by a given hazard and divide by the total population in the area exposed to that hazard • e.g. globally, for storms : • 240,000+ fatalities between 1981 and 2000 • 1,312 million people in exposed area in 2000 • 16.6 fatalities per 100,000 population (note time periods) • we can apply this rate to the population grid in areas exposed to the hazard to produce an estimate of expected fatalities over a 20 year period 5Th EM-DAT Technical Advisory Group Meeting
Geographic variations in mortality • but: mortality is not distributed uniformly e.g., earthquake of a given magnitude does more damage in India than in Japan • social, economic and physical factors that reduce vulnerability: building codes, emergency response, education, topography, geology • many of these are related to the wealth of a country • Country data in EM-DAT is noisy 5Th EM-DAT Technical Advisory Group Meeting
Geographic disaggregation • => use regionally specific mortality rates WB regions classified into four income groups • geographically and hazard specific mortality rates provide a better estimate of potential vulnerability 5Th EM-DAT Technical Advisory Group Meeting
Geographic disaggregation World Bank regions by income group 5Th EM-DAT Technical Advisory Group Meeting
Incorporating hazard severity • mortality rates will be higher in areas where severity measures are larger • some indication of how severely different areas are affected within exposed area • measures of severity: estimates of frequency or probability, frequency by wind strength, expected potential peak ground acceleration for earthquakes • use severity as a weight to adjust mortality rates 5Th EM-DAT Technical Advisory Group Meeting
In summary • mortality rate • weighted cell mortality • adjustment • multi-hazard where: h = hazard, i = grid cell, j = region_wealth M = mortality (EM-DAT), P = population (GPW3), W = hazard severity weight 5Th EM-DAT Technical Advisory Group Meeting
Hurricane Severity and Intensity 5Th EM-DAT Technical Advisory Group Meeting
Uniform Global Mortality Rate log of mortality 5Th EM-DAT Technical Advisory Group Meeting
Region Specific Mortality Rate log of mortality 5Th EM-DAT Technical Advisory Group Meeting
Region Specific Mortality Weighted by Hazard Severity log of mortality 5Th EM-DAT Technical Advisory Group Meeting
Global results • although the model output presents an estimate of predicted cumulative mortality from all hazards over a twenty year period, we interpret it as a notional index (lowhigh) • hazard specific mortality-weighted indexes • combined, multi-hazard hotspots index • the same methodology can be applied to economic losses (globally /proportion) 5Th EM-DAT Technical Advisory Group Meeting
Estimated Mortality rates • highest mortality rates: • droughts: AFR low income • earthquakes: ECA low middle income • floods: LAC upper middle income • storms: SA low income • landslides: EAP upper middle income • volcanoes: LAC low middle income • given the limited time period and quality of input data => relative risk levels / deciles: 5Th EM-DAT Technical Advisory Group Meeting
Drought mortality risk hotspots 5Th EM-DAT Technical Advisory Group Meeting
Identification of areas affected by multiple hazards 5Th EM-DAT Technical Advisory Group Meeting
All hazards mortality risk hotspots note Africa vs. Europe 5Th EM-DAT Technical Advisory Group Meeting
All hazards total economic loss risk hotspots note Africa vs. Europe 5Th EM-DAT Technical Advisory Group Meeting
All hazards Prop economic loss risk hotspots note Africa vs. Europe 5Th EM-DAT Technical Advisory Group Meeting
Conclusion • impact-weighted multi-hazard hotspots index combines information on hazard extent, exposed elements and vulnerability (based on historic impacts) • Scope for refinement • Better weights / response function (feasible?) • narrower definition of exposed area (hazards maps) • better (more complete) damage estimates (EM-DAT) • better definition of exposed economic assets 5Th EM-DAT Technical Advisory Group Meeting
Thank you 5Th EM-DAT Technical Advisory Group Meeting
5Th EM-DAT Technical Advisory Group Meeting
Statistical determination of weights • consider hazard severity as the dose and hazard impacts as the response • requires ability to link specific hazard events (e.g., hurricanes) to their impacts (fatalities, economic damage) • statistical estimation also yields measures of accuracy • e.g., Mh = βo + β1Hh + β2Xh+ εwhereMh = damage (mortality) from disaster event hHh = characteristics of the hazard leading to disasterXh = exposure and vulnerability characteristics of area affectedβ1 = an estimate of severity weight W 5Th EM-DAT Technical Advisory Group Meeting
Statistical determination of weights • “dose-response function” could be any shape or form hazard impact hazard severity 5Th EM-DAT Technical Advisory Group Meeting
Estimated mortality rates fatalities 1981-2000 per 100,000 inhabitants in 2000 5Th EM-DAT Technical Advisory Group Meeting
Caveats • this is an intuitive approach and relatively easy to implement (but: it builds on many years of diligent data development!) • main problem: weighting is ad hoc and deterministic – need to know: • what should be the cutoff for exposed area? • at what level of severity does damage occur? • how does damage vary with changes in severity? 5Th EM-DAT Technical Advisory Group Meeting
Mask areas of low pop, non-ag 55 % of area, 99 % of population remains 5Th EM-DAT Technical Advisory Group Meeting