Download
1 / 21
210 likes | 377 Views
Cultural values as constraints and facilitators of socio-economic change. Shalom H. Schwartz The Hebrew University of Jerusalem and Higher School of Economics, Moscow October 10, 2013. Overview. Three dimensions for measuring societal culture Mapping of world cultures & of Europe

E N D
Cultural values as constraints and facilitators of socio-economic change Shalom H. Schwartz The Hebrew University of Jerusalem and Higher School of Economics, Moscow October 10, 2013
Overview • Three dimensions for measuring societal culture • Mapping of world cultures & of Europe • National culture as constraint & influence on socio-economic change [empirical evidence] • Health Expenditures • Military expenditures • Democracy • Income inequality • Tax burden • Corruption
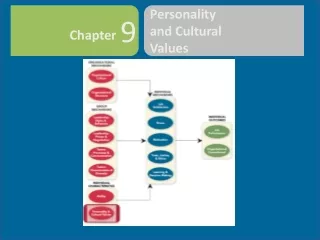
Evolution of Cultural Value Emphases • All societies confront basic problems in regulating human activity • Societal responses to basic problems emphasize certain values and sacrifice others • Derive 3 bipolar cultural value dimensions/ orientations from societal responses to 3 problems
CULTURAL DIMENSIONS: PROTOTYPICAL STRUCTURE Ideal Individual / Group Relationship People:role players embedded in groups Individuals inde-pendent actors
CULTURAL DIMENSIONS: PROTOTYPICAL STRUCTURE Ideal way to elicit productive, cooperative, activity in society Hierarchical alloca-tion roles/resources legitimate/desirable • Socialize: Others morally equal • transcend selfish interests • cooperate voluntarily
CULTURAL DIMENSIONS: PROTOTYPICAL STRUCTURE Regulate use of human and natural resources fit harmoniously, avoid change & self-assertion master, control, change through assertive action
Measuring Cultural Value Orientations • Cultural value orientations shape daily contingencies to which individuals adapt • Define what viewed as more or less legitimate • Define what expected, encouraged or discouraged • Individuals in a society exposed to ‘press’ • share many value-relevant experiences • socialized to take for granted shared social values Average of value priorities of all individuals • Unique individual differences don’t affect average
Data and Sources • 77 cultural groups, 74 countries, N=55,022 • Dominant cultural group: average of teachers & students in most • Data gathered between 1988-2010, most 1990-1998, median 1995 • 46 value items with near equivalent meaning in within-country analyses, based on within sample MDS
Measurement: SVS "What values are important to ME as guiding principles in MY life, and what values are less important to me?" AS A GUIDING PRINCIPLE IN MY LIFE, this value is: opposed of to my not very supreme values important importantimportant importance -1 0 1 2 3 4 5 6 7 Before you begin, choose one that is most important to you ….one that is most opposed to your values…. [self-anchoring] 1 EQUALITY (equal opportunity for all) 2 INNER HARMONY (at peace with myself) 3 ____SOCIAL POWER (control over others, dominance)
Russia & Sweden: Sum of distances = 4.4 Russia: Poland 0.8; USA 1.6; Gt Britain 2.5; France 3.8 Create 77 x 77 matrix with cultural distances in cells Map countries by distances in 2 dimensional space Mapping National Cultures • Compute cultural distances between all pairs of cultural groups • Sum absolute distances on each of 7 orientations
Cultural Map of World Regions EMBEDDEDNESSorder, obedience HARMONYfitting in, no change Muslim Middle East & Sub-Saharan Africa East-Central & Baltic Europe Prot/Cath EGALITARIANISMjustice South & South East Asia East Europe Orthodox West Europe Latin America INTELLECTUAL AUTONOMYcuriosity Confucian English Speaking HIERARCHYauthority AFFECTIVE AUTONOMYpleasure MASTERY ambition, change
35 European countries mapped on 7 cultural values HARMONY(.81) EMBEDDEDNESS(.97) SLOVAKIA BOSNIA- HERZEG. ITALY SLOVENIA GEORGIA CZECHIA FINLAND ESTONIA CYPRUS gk HUNGARY NORWAY SPAIN LATVIA ARMENIA EGALITARIANISM(.80) POLAND BELGIUM WGERMANY SWEDEN SERBIA DENMARK MACEDONIA AUSTRIA EGERMANY INTELLECTUAL AUTONOMY(.90) BULGARIA PORTUGAL ROMANIA RUSSIA SWITZERLAND NETHERLANDS UKRAINE GREECE FRANCE CROATIA IRELAND AFFECTIVE AUTONOMY(.89) GT BRITAIN HIERARCHY(.80) MASTERY(.77)
Cultural Orientations Correlates (Controlled for Country GDPpc)
Cultural Orientations Predict Change in Democracy across Countries .29 Democracy 1985 Democracy 1995 R2=.57 .50 .43 .71 Democracy 2009 .32 Values 1995 Autonomy vs. Embeddedness GDPpc 1985 .78 GDPpc (85, 95, or 00) does not add to prediction 4 Hofstede dimensions do not enter (N=67) 2 Inglehart dimensions (1999) do not enter (N=57)
Change in Public Health Expenditures Adj. R2=.92 GDPpc 1990 Autonomy vs. Embeddedness 1995 .75 .19 Public Health Expenditure %GDP 2005 .35 .80 Public Health Expenditure %GDP 2000 Public Health Expenditure %GDP 1990 .57 N=68 countries Inglehart dimensions do not enter Hofstede Ind/Col and UncAvoid add with N= 53, AutEmb remains All betas p<.01
Change in Military Expenditures Log Military Expenditures %GDP 1992 Adj. R2 =.62 .55 .27 Western Europe Log Military Expenditures %GDP 2006 Harmony vs. Mastery 1995 .43 -.20 .59 .28 -.23 Middle East North Africa Autonomy vs. Embeddedness 1995 -.29 N=70 countries Inglehart and Hofstede dimensions do not enter
Change in Income Inequality (Gini) Adj. R2=.67 Gini 1989 closest .59 Gini 2007 closest .24 Roman Catholic .30 Autonomy vs. Embeddedness 1995 -.31 .74 .58 -.19 .33 • Egalitarianism vs. Hierarchy 1995 GDPpc 1990 .50 N=59 countries Hofstede dimensions do not enter Inglehart Trad/SecRat & Surv/SExpr show similar effects (N=51)
Conclusions • 7 cultural value orientations capture significant aspects of societal cultures • Countries across the world form broad cultural regions that vary in meaningful ways on these orientations • Analyses of European countries reveal four distinct cultural regions: Anglo, West, East Central and East
Conclusions • Consistent contrast of opposing orientations yields 3 cultural dimensions: Aut/Emb, Egal/Hier, Har/Mast • National differences on 3 dimensions correlate with & predict later levels of public health expenditures level of democracy military expenditures corruption income inequality tax burden on the wealthy • Cultural differences on 3 dimensions • constrain or facilitate temporal change in societal variables • mediate effects of religion and GDPpc on change Consider adding cultural value orientations to your toolbox
Some References • Schwartz, S. H. (2006). A theory of cultural value orientations: Explication and applications. Comparative Sociology, 5, 137-182. Also in Y. Esmer & T. Pettersson (Eds.) (2007). Measuring and mapping cultures: 25 years of comparative value surveys (pp. 33-78). Leiden, The Netherlands: Brill. • S. H. (2009). Culture matters: National value cultures, sources and consequences. In C.-Y. Chiu, Y.Y. Hong, S. Shavitt, & R. S. Wyer, Jr. (Eds.), Understanding culture: Theory, research and application (pp. 127-150).New York: Psychology Press. • Schwartz, S. H. (2011). Values: Individual and cultural. In S. M. Breugelmans, A. Chasiotis, & F. J. R. van de Vijver (Eds.), Fundamental questions in cross-cultural psychology (pp. 463-493). Cambridge: Cambridge University Press.