Download
1 / 22
220 likes | 304 Views
M oving to the final chapter of the AIDS epidemic. The agreed target are about to expire…. Treatment continues to expand. 2003. 2015. Treatment continues to expand. 2003. 2015. UNAIDS PCB calls for new targets. Targets drive progress New scientific evidence Post 2015 Accountability

E N D
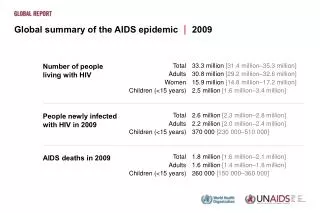
Moving to the final chapter of the AIDS epidemic
Treatment continues to expand 2003 2015
Treatment continues to expand 2003 2015
UNAIDS PCB calls for new targets • Targets drive progress • New scientific evidence • Post 2015 • Accountability • A winnable challenge
Status quo The choices Continue the current pace WHO 2013 guidelines • Rapid scale-up to universal access
The new treatment paradigm Single target → Cascade target Death → Death and transmission Number → Equity Incremental funding→ Frontload Investments
HIV+ population tested at least once Women Men Source: Demographic and Health Surveys
Access To Virologic HIV Testing(Early Infant Diagnosis) 2012 *Lesotho data represents 2011 coverage dataSource: UNAIDS, UNICEF and WHO, 2013 Global AIDS Response Progress Reporting, and UNAIDS modeling2012 HIV and AIDS estimates.
high coverage in several countries Brazil UNGASS Country Progress Report(2012) UNAIDS Situation Room
Proportion (95% CI) of patients with undetectable VL in a nationally representative sample of HIV-infected adults on ART in Rwanda 100.00% 83% 80.00% 60.00% 40.00% 20.00% Site J Site Q Site T Site G Site L Site P Site S Site F Site I Site M Site R Total Site O Site K Site E Site H Site D Site N Site C Site B Site A Source: Basinga P et al. (2013) PLoS
Challenges ahead: 1- Societal • Lack of knowledge of HIV status • Punitive policies and laws • Stigma and discrimination
Challenges ahead: 2- delivery systems Relative likelihood of HIV-positive adults (15-49 years) accessing antiretroviral therapy due to the distance from their nearest primary healthcare facility. Source: Location, Location: Connecting people faster to HIV services, UNAIDS; Geneva, 2013
Uptake of pediatric HIV services after introduction of family-based approach Luyirika et al. PLoS ONE, 2013
Cost of treatment per ART patient year by country US Dollars Challenges ahead: 3- diverse facility level costs Maximum Average US$682 US$ Minimum US$278 US$232 US$186 US$136 South Africa* *Republic of South Africa: costs include updated antiretroviral prices, which were renegotiated by the RSA government in early 2010 and are 53% lower than those observed during the costing period.
Challenges ahead: 4- treatment cascade Notes: No systematic data are available for the proportion of people living with HIV who are linked to care, although this is a vital step to ensuring viral suppression in the community. Sources: 1. UNAIDS 2012 estimates; 2. Demographic and Health Surveys, 2007–2011 (www.measuredhs.com); 3. Kranzer, K., van Schaik, N., et al. (2011), PLoS ONE; 4. GARPR 2012; 5. Barth R E, van der Loeff MR, et al. (2010), Lancet Infect Disease.
Challenges ahead: 5-Financing Malawi Lesotho 5% – 8% Zimbabwe Mozambique Burundi Uganda Central African Rep. 2% – 5% Tanzania Zambia Swaziland Kenya Liberia Togo Rwanda 1% – 2% Sierra Leone Cameroon ART costs as a percentage of GDP Chad Guinea-Bissau Côte d’Ivoire Botswana Haiti Guinea Namibia Djibouti Nigeria South Africa 0.1% – 1% Burkina Faso Niger Benin Eritrea Ghana Mali Cambodia Belize Myanmar Senegal 0 1 2 3 4 5 6 7 8% Source: Williams arXiv 2012: http://arxiv.org/abs/1206.6774