Download
1 / 48
480 likes | 616 Views
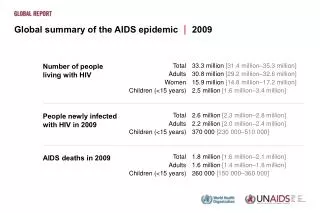
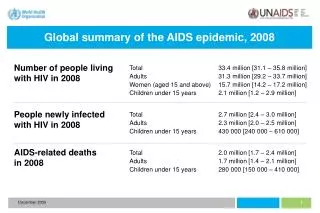
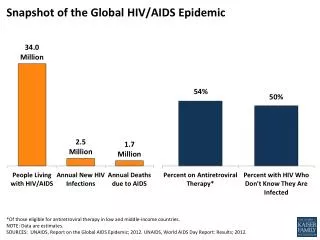
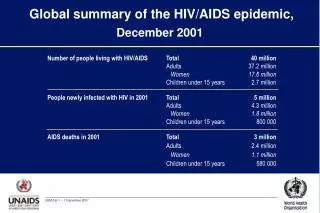
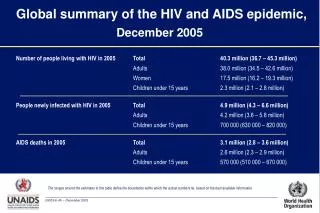
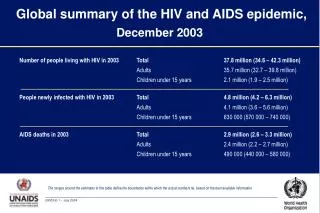
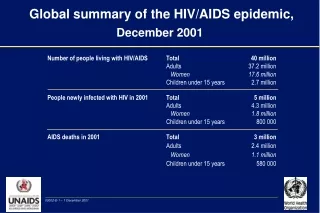
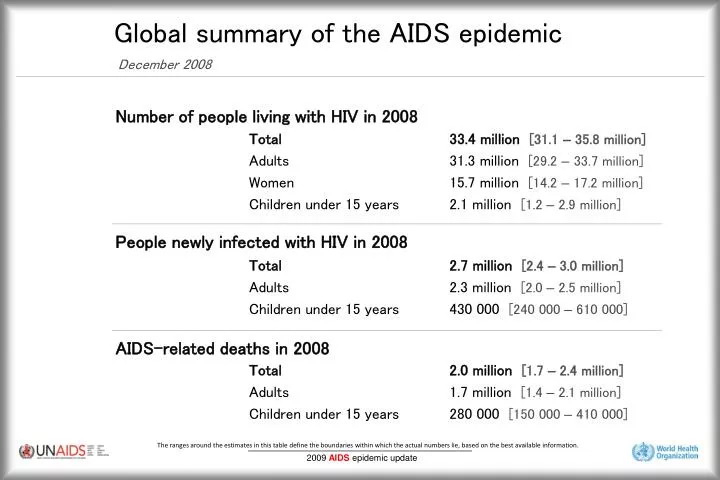
Global summary of the AIDS epidemic December 2008. Number of people living with HIV in 2008. Total 33.4 million [31.1 – 35.8 million] Adults 31.3 million [29.2 – 33.7 million] Women 15.7 million [14.2 – 17.2 million] Children under 15 years 2.1 million [1.2 – 2.9 million]

E N D
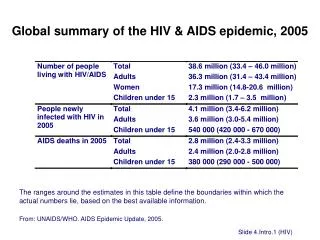
Global summary of the AIDS epidemic December 2008 Number of people living with HIV in 2008 Total33.4 million [31.1 – 35.8 million] Adults 31.3 million [29.2 – 33.7 million] Women 15.7 million [14.2 – 17.2 million] Children under 15 years 2.1 million [1.2 – 2.9 million] Total2.7 million [2.4 – 3.0 million]Adults 2.3 million [2.0 – 2.5 million]Children under 15 years 430 000 [240 000 – 610 000] Total2.0 million [1.7 – 2.4 million]Adults 1.7 million [1.4 – 2.1 million]Children under 15 years 280 000 [150 000 – 410 000] People newly infected with HIV in 2008 AIDS-related deaths in 2008 The ranges around the estimates in this table define the boundaries within which the actual numbers lie, based on the best available information.
Global estimates 1990–2008 Number of people living with HIV Adult (15–49) HIV prevalence (%) 40 1.2 30 0.9 Number(millions) % 20 0.6 10 0.3 0 0 1990 1993 1996 1999 2002 2005 2008 1990 1993 1996 1999 2002 2005 2008 Number of people newly infected with HIV Number of adult and child deaths due to AIDS 5 5 4 4 Number(millions) Number(millions) 3 3 2 2 1 1 0 0 1990 1993 1996 1999 2002 2005 2008 1990 1993 1996 1999 2002 2005 2008 Estimate High and low estimates Source: UNAIDS/WHO Figure I
Regional HIV and AIDS statistics 2008 and 2001 (First of 2 parts) Adults & children living with HIV Adults & children newly infected with HIV 2008 2001 2008 2001 22.4 million [20.8 – 24.1 million] 19.7 million [18.3 – 21.2 million] 1.9 million [1.6 – 2.2 million] 2.3 million [2.0 – 2.5 million] Sub–Saharan Africa 310 000 [250 000 – 380 000] 200 000 [150 000 – 250 000] 35 000 [24 000 – 46 000] 30 000 [23 000 – 40 000] Middle East & North Africa 3.8 million [3.4 – 4.3 million] 4.0 million [3.5 – 4.5 million] 280 000 [240 000 – 320 000 310 000 [270 000 – 350 000] South and South–East Asia 850 000 [700 000 – 1.0 million] 560 000 [480 000 – 650 000] 75 000 [58 000 – 88 000] 99 000 [75 000 – 120 000] East Asia 2.0 million [1.8 – 2.2 million] 1.6 million [1.2 – 1.6 million] 170 000 [150 000 – 200 000] 150 000 [140 000 – 170 000] Latin America 240 000 [220 000 – 260 000] 220 000 [200 000 – 240 000] 20 000 [16 000 – 24 000] 21 000 [17 000 – 24 000] Caribbean 1.5 million [1.4 – 1.7 million] 900 000 [800 000 – 1.1 million] 110 000 [100 000 – 130 000] 280 000 [240 000 – 320 000] Eastern Europe & Central Asia 850 000 [710 000 – 970 000] 660 000 [580 000 – 760 000] 30 000 [23 000 – 35 000] 40 000 [31 000 – 47 000] Western & Central Europe 1.4 million [1.2 – 1.6 million] 1.2 million [1.1 – 1.4 million] 55 000 [36 000 – 61 000] 52 000 [42 000 – 60 000] North America 59 000 [51 000 – 68 000] 36 000 [29 000 – 45 000] 3900 [ 2900 – 5100] 5900 [ 4800 – 7300] Oceania TOTAL 33.4 million[31.1 – 35.8 million] 29.0 million[27.0 – 31.0 million] 2.7 million[2.4 – 3.0 million] 3.2 million[2.9 – 3.6 million]
Regional HIV and AIDS statistics 2008 and 2001 (Last of 2 parts) Adult prevalence (%) Adult & child deaths due to AIDS 2008 2001 2008 2001 Sub–Saharan Africa 1.4 million [1.1 – 1.7 million] 1.4 million [1.2 – 1.7 million] 5.2% [4.9% – 5.4%] 5.8% [5.5% – 6.0%] Middle East & North Africa 20 000 [15 000 – 25 000] 11 000 [7800 – 14 000] 0.2% [<0.2% – 0.3%] 0.2% [0.1% – 0.2%] South and South–East Asia 270 000 [220 000 – 310 00] 260 000 [210 000 – 320 000] 0.3% [0.2% – 0.3%] 0.3% [<0.3% – 0.4%] East Asia 59 000 [46 000 – 71 000] 22 000 [18 000 – 27 000] 0.1% [<0.1%] <0.1% [<0.1%] Latin America 77 000 [66 000 – 89 000] 66 000 [56 000 – 77 000] 0.6% [0.5% – 0.6%] 0.5% [<0.5% – 0.6%] Caribbean 12 000 [9300 – 14 000] 20 000 [17 000 – 23 000] 1.0% [0.9% – 1.1%] 1.1% [1.0% – 1.2%] Eastern Europe & Central Asia 87 000 [72 000 – 110 000] 26 000 [22 000 – 30 000] 0.7% [0.6% – 0.8%] 0.5% [0.4% – 0.5%] Western & Central Europe 13 000 [10 000 – 15 000] 7900 [6500 – 9700] 0.3% [0.2% – 0.3%] 0.2% [<0.2% – 0.3%] North America 25 000 [20 000 – 31 000] 19 000 [16 000 – 23 000] 0.6% [0.5% – 0.7%] 0.6% [0.5% – 0.7%] Oceania 2000 [1100 – 3100] <1000 [<500 – 1200] 0.3% [<0.3% – 0.4%] 0.2% [<0.2% – 0.3%] TOTAL 0.8% [<0.8% – 0.8%] 0.8% [<0.8% – 0.8%] 2.0 million[1.7 – 2.4 million] 1.9 million[1.6 – 2.2 million]
Estimate of the annual number of infant infections averted through the provision of antiretroviral prophylaxis to HIV-positive pregnant women, globally, 1996–2008 70 000 60 000 50 000 40 000 Infant infections averted 30 000 20 000 10 000 0 1997 1999 2001 2003 2005 2007 1996 1998 2000 2002 2004 2006 2008 Figure II
Estimated number of new child infections at current levels of antiretroviral prophylaxis and without antiretroviral prophylaxis , globally, 1996–2008 600 000 500 000 400 000 300 000 200 000 100 000 0 1996 1997 1998 1999 2000 2001 2002 2003 2004 2005 2006 2007 2008 No prevention of mother-to-child transmission At current levels of antiretroviral prophylaxis Figure III
Regional estimates of the number of infant infections at current levels of antiretroviral prophylaxis and without antiretroviral prophylaxis Asia Latin America Eastern Europe and Central Asia 10 60 6 50 5 8 40 4 (thousands) (thousands) (thousands) 6 30 3 4 20 2 2 10 1 0 0 0 1996 1998 2000 2002 2004 2006 2008 1996 1998 2000 2002 2004 2006 2008 1996 1998 2000 2002 2004 2006 2008 Caribbean Middle East and North Africa Sub-Saharan Africa 5 500 3.5 3.0 4 400 2.5 (thousands) (thousands) (thousands) 3 300 2.0 1.5 2 200 1.0 1 100 0.5 0 0 0 1996 1998 2000 2002 2004 2006 2008 1996 1998 2000 2002 2004 2006 2008 1996 1998 2000 2002 2004 2006 2008 No prevention of mother-to-child transmission At current levels of antiretroviral prophylaxis Figure IV
3.0 2.5 2.0 1.5 Number (millions) 1.0 0.5 0 1996 1997 1998 1999 2000 2001 2002 2003 2004 2005 2006 2007 2008 Year No antiretroviral therapy At current levels of antiretroviral therapy Estimated number of AIDS-related deaths with and without antiretroviral therapy, globally, 1996–2008 Figure V
No antiretroviral therapy At current levels of antiretroviral therapy Estimated number of AIDS-related deaths with and without antiretroviral therapy, by region, 1996–2008 Asia Caribbean Eastern Europe and Central Asia 500 25 120 100 400 20 80 (thousands) (thousands) (thousands) 300 15 60 200 10 40 100 5 20 0 0 0 1996 1998 2000 2002 2004 2006 2008 1996 1998 2000 2002 2004 2006 2008 1996 1998 2000 2002 2004 2006 2008 Latin America Middle East and North Africa Sub-Saharan Africa 160 25 2.0 20 1.6 120 (thousands) (thousands) 15 1.2 (millions) 80 10 0.8 40 5 0.4 0 0 0 1996 1998 2000 2002 2004 2006 2008 1996 1998 2000 2002 2004 2006 2008 1996 1998 2000 2002 2004 2006 2008 Figure VI
Estimated number of Life-years added due to antiretroviral therapy, by region, 1996–2008 8 7.2 million 7 6 5 (millions) 4 3 2.3 million 2 1.4 million 1 590 000 73 000 40 000 49 000 7500 0 Western Europe and North America Sub- Saharan Africa Latin America Asia Eastern Europe and Central Asia Caribbean Oceania Middle East and North Africa Figure VII
Adult (aged 15–49) HIV prevalence in (sub-) national population-based surveys which include HIV testing, 2001–2008 HIV prevalence (%) HIV prevalence (%) Country Country (Year) (Year) Sub–Saharan Africa Benin 1.2 Nigeria 3.6 (2006) (2007) Botswana 25.0 Rwanda 3.0 (2008) (2005) 25.2 Senegal 0.7 (2004) (2005) Burkina Faso 1.8 Sierra Leone 1.5 (2003) (2008) Burundi 3.0 1.5 (2007) (2005) 3.6 16.9 South Africa (2002) (2008) Cameroon 5.5 16.2 (2004) (2005) Central African Republic 6.2 15.6 (2006) (2002) Chad 3.3 Swaziland 25.9 (2005) (2006–07) Congo 3.2 Uganda 6.4 (2009) (2004–05) Côte d'Ivoire 4.7 UR Tanzania 5.7 (2005) (2007) DR Congo 1.3 7.0 (2007) (2004) Djibouti 2.9 Zambia 14.3 (2002) (2007) Equatorial Guinea 3.2 15.6 (2004) (2001–02) Ethiopia 1.4 Zimbabwe 18.1 (2005) (2005–06) Ghana 2.2 (2003) Guinea 1.5 Asia (2005) Kenya 7.8 Cambodia 0.6 (2008) (2005) 6.7 India 0.3 (2003) (2005–06) Lesotho 23.4 Papua province (Indonesia) 2.4 (2004) (2006) Liberia 1.6 Hai Phong province (Viet Nam) 0.5 (2007) (2005) Malawi 12.7 (2004) Mali 1.3 Caribbean (2006) 1.8 Dominican Republic 0.8 (2001) (2007) Niger 0.7 1.0 (2006) (2002) 0.9 Haiti 2.2 (2002) (2005–06)
Sub-Saharan Africa Number of people living with HIV 2008 22.4 million [20.8 million–24.1 million] 2001 19.7 million [18.3 million–21.2 million] Number of new infections 2008 1.9 million [1.6 million–2.2 million] 2001 2.3 million [2.0 million–2.5 million] Number of children newly infected 2008 390 000 [210 000–570 000] 2001 460 000 [260 000–640 000] Number of AIDS-related deaths 2008 1.4 million [1.1 million–1.7 million] 2001 1.4 million [1.2 million–1.7 million]
Sub-Saharan Africa estimates 1990–2008 Number of people living with HIV Adult (15–49) HIV prevalence (%) 25 10 20 8 Number(millions) 15 6 % 10 4 5 2 0 0 1990 1993 1996 1999 2002 2005 2008 1990 1993 1996 1999 2002 2005 2008 Number of people newly infected with HIV Number of adult and child deaths due to AIDS 4 4 3 3 Number(millions) Number(millions) 2 2 1 1 0 0 1990 1993 1996 1999 2002 2005 2008 1990 1993 1996 1999 2002 2005 2008 Estimate High and low estimates Source: UNAIDS/WHO Figure 1
HIV prevalence by marital status and gender in the general populations of nine West African countries Burkina Faso Benin Côte d’Ivoire 16 16 16 14.9 14 14 14 11.0 12 12 12 10.6 10 10 10 7.2 8 8 8 % % % 6.3 6.1 6 6 6 4.6 3.6 4 4 4 2.8 too few cases too few cases 2.3 2.2 1.6 1.3 1.3 1.2 2 2 2 0.8 0.5 0.2 Female 0 0 0 Single Widowed Single Single Divorced/ separated/ widowed Divorced/ separated/ widowed Married/ cohabiting Divorced/ separated Married/ cohabiting Married/ cohabiting Male Ghana Guinea Mali 16 16 16 14.8 14 14 14 12 12 12 10 10 10 8.2 8 8 8 % % % 6.7 6.2 6 6 6 3.9 3.3 2.9 4 4 4 too few cases too few cases too few cases 2.3 2.2 1.8 1.6 1.4 1.3 1.2 1.1 0.9 2 2 2 0.6 0.6 0.4 0.3 0.0 0 0 0 Single Widowed Single Widowed Single Widowed Married/ cohabiting Divorced/ separated Married/ cohabiting Divorced/ separated Married/ cohabiting Divorced/ separated Niger Senegal Sierra Leone 16 16 16 14 14 14 12 12 12 10 10 10 8 8 8 % % % 6.4 5.3 6 6 6 3.9 3.8 3.6 3.1 4 4 4 too few cases too few cases 2.2 2.2 1.8 1.8 1.4 0.9 0.9 0.9 0.9 2 2 2 0.5 0.4 0.4 0.3 0.0 0 0 0 Single Widowed Single Single Widowed Divorced/ separated/ widowed Married/ cohabiting Divorced/ separated Married/ cohabiting Married/ cohabiting Divorced/ separated Source: Lowndes et al. (2008). Figure 2
Distribution of new infections by mode of exposure in Ghana and Swaziland, 2008 100 No risk 80 Medical injections Blood transfusions Injecting drug use (IDU) Partners IDU 60 Sex workers % Clients Partners of Clients 40 Men who have sex with men (MSM) Female partners of MSM Engaged in casual sex (CS) 20 Partners of CS Low-risk heterosexual 0 Ghana Swaziland 1 Swaziland 2 Note: sensitivity analysis for Swaziland used different data sources. Sources: Bosu et al. (2009) and Mngadi et al. (2009). Figure 3
HIV prevalence among antenatal clinic clients in Swaziland, 1992–2008 50 40 30 HIV prevalence (%) 20 10 0 1992 1994 1996 1998 2000 2002 2004 2006 2008 Source: Ministry of Health and Social Welfare (2009). Figure 4
Age at first sexual intercourse by education status in Swaziland, 2007 100 No education Lower primary 80 Higher primary Secondary High School 60 Tertiary % 40 20 0 Women < 15 yrs Women < 18 yrs Men < 15 yrs Men < 18 yrs Sources: Central Statistical Office & Macro International (2008). Figure 5
HIV prevalence among men who have sex with men in countries in sub-Saharan Africa, 2002–2008 50 40 30 HIV prevalence (%) 20 10 0 Botswana Malawi Namibia South Africa 1 Zambia Kenya 2 UR Tanzania Nigeria Senegal South Africa 2 Kenya 1 Southern Africa East Africa West Africa Source: Smith et al. (2009), Baral et al. (2009), and Sanders et al. (2007) Figure 6
Asia Number of people living with HIV 2008 4.7 million [3.8 million–5.5 million] 2001 4.5 million [3.8 million–5.2 million] Number of new infections 2008 350 000 [270 000–410 000] 2001 400 000 [310 000–480 000] Number of children newly infected 2008 21 000 [13 000–29 000] 2001 33 000 [18 000–49 000] Number of AIDS-related deaths 2008 330 000 [260 000–400 000] 2001 280 000 [230 000–340 000]
Asia estimates 1990–2008 Number of people living with HIV Adult (15–49) HIV prevalence (%) 8 0.4 6 0.3 Number(millions) % 4 0.2 2 0.1 0 0 1990 1993 1996 1999 2002 2005 2008 1990 1993 1996 1999 2002 2005 2008 Number of people newly infected with HIV Number of adult and child deaths due to AIDS 1.0 1.0 0.8 0.8 Number(million) Number(million) 0.6 0.6 0.4 0.4 0.2 0.2 0 0 1990 1993 1996 1999 2002 2005 2008 1990 1993 1996 1999 2002 2005 2008 Estimate High and low estimates Source: UNAIDS/WHO Figure 7
Age-adjusted HIV prevalence among antenatal attendees aged 15–24 from 2000 to 2007 in high-prevalence southern states (Andhra Pradesh, Karnataka, Maharashtra and Tamil Nadu) and northern states of India 2.5 Southern states 2.0 Northern states 1.5 Age-adjusted HIV prevalence (%) 1.0 0.5 0.0 2000 2001 2002 2003 2004 2005 2006 2007 Logarithmic trend line; test for trend by logistic regression, with age adjustment to the entire study population, n = 202 254 for the south, n = 221 588 for the north. Source: Arora et al. (2008). Figure 8
Vulnerability to sexual HIV transmission in commercial sex in Karachi and Lahore, Pakistan Female sex workers (FSWs) 28 60 82 20 Male clients of FSWs 45 61 Male sex workers 42 57 63 31 Hijras 51 55 0 20 40 60 80 100 Per cent Has never heard of HIV/AIDS Does not know that condoms can prevent transmission of HIV No perceived HIV risk Source: Bokhari et al. (2007). Figure 9
Saturating prevention coverage through complementary programming. Avahan has achieved a high coverage of target populations (routine programme monitoring data) Manipur 35 000 est. 62% 26% 12% Injecting drug users Nagaland 28 000 est. 53% 26% 22% Karnataka 89 000 est. 22% 58% 20% 29% 61% 11% Andhra Pradesh 115 000 est. Female sex workers 26% 74% Maharashtra 72 000 est. 38% 36% 26% Tamil Nadu* 84 000 est. Karnataka 26 000 est. 15% 70% 14% High Risk – Men who have sex with men 19% 76% 5% Andhra Pradesh 46 000 est. 64% 36% Maharashtra 27 000 est. 24% 49% 26% Tamil Nadu* 21 000 est. Percent of Mapped Urban Key Population covered** Government of India and Others Avahan Uncovered Percentages indicate intended coverage through establishment of services in specific geographic areas. * Includes districts with no intended coverage. ** Mapping and size estimation quality varies by state. Does not include rural areas Source: Avahan and State AIDS Control Society programme data (2008). Figure 10
Comparison of the incidence of syphilis in China reported from 26 sentinel sites and from the nationwide sexually transmitted disease surveillance system 35 30 25 20 Incidence (per 100 000) 15 10 5 0 1993 1994 1995 1996 1997 1998 1999 2000 2001 2002 2003 2004 2005 Reported incidence of total syphilis from sentinel sites Reported incidence of total syphilis from the nationwide sexually transmitted disease surveillance system Source: Chen et al. (2007). Figure 11
Trends in HIV, hepatitis B, hepatitis C and syphilis in men who have sex with men in Beijing in 2004, 2005 and 2006 14 12 10 HIV Hepatitis B 8 Hepatitis C Prevalence (%) Syphilis 6 4 2 0 2004 2005 2006 Source: Ma et al. (2007). Figure 12
Eastern Europe and Central Asia Number of people living with HIV 2008 1.5 million [1.4 million–1.7 million] 2001 900 000 [800 000–1.1 million] Number of new infections 2008 110 000 [100 000–130 000] 2001 280 000 [240 000–320 000] Number of children newly infected 2008 3700 [1700–6000] 2001 3000 [1600–4300] Number of AIDS-related deaths 2008 87 000 [72 000–110 000] 2001 26 000 [22 000–30 000]
Eastern Europe and Central Asia estimates 1990–2008 Number of people living with HIV Adult (15–49) HIV prevalence (%) 2.0 1.0 1.6 0.8 Number(millions) 1.2 0.6 % 0.8 0.4 0.4 0.2 0 0 1990 1993 1996 1999 2002 2005 2008 1990 1993 1996 1999 2002 2005 2008 Number of people newly infected with HIV Number of adult and child deaths due to AIDS 400 400 300 300 Number(thousands) Number(thousands) 200 200 100 100 0 0 1990 1993 1996 1999 2002 2005 2008 1990 1993 1996 1999 2002 2005 2008 Estimate High and low estimates Source: UNAIDS/WHO Figure 13
HIV cases per million population in the WHO Eastern Europe region by year of notification, 2000–2007 180 160 140 120 100 HIV cases per million population 80 60 40 20 0 2000 2001 2002 2003 2004 2005 2006 2007 Note: Data from Russian Federation not included. Source: Van de Laar et al. (2008). Figure 14
Caribbean Number of people living with HIV 2008 240 000 [220 000–260 000] 2001 220 000 [200 000–240 000] Number of new infections 2008 20 000 16 000–24 000 2001 21 000 [17 000–24 000] Number of children newly infected 2008 2300 [1400–3400] 2001 2800 [1700–4000] Number of AIDS-related deaths 2008 12 000 [9300–14 000] 2001 20 000 [17 000–23 000]
Caribbean estimates 1990–2008 Number of people living with HIV Adult (15–49) HIV prevalence (%) 400 2.0 Number(thousands) 300 1.5 % 200 1.0 100 0.5 0 0 1990 1993 1996 1999 2002 2005 2008 1990 1993 1996 1999 2002 2005 2008 Number of people newly infected with HIV Number of adult and child deaths due to AIDS 80 80 60 60 Number(thousands) Number(thousands) 40 40 20 20 0 0 1990 1993 1996 1999 2002 2005 2008 1990 1993 1996 1999 2002 2005 2008 Estimate High and low estimates Source: UNAIDS/WHO Figure 15
HIV prevalence trends among young people (aged 15–24) in the Dominican Republic, 1991–2007 2.5 Pregnant women at La Altagracia Hospital, Santo Domingo 2.0 Women in population-based survey Men in population-based survey 1.5 HIV prevalence (%) 1.0 0.5 0.0 1991 1992 1993 1994 1995 1996 1997 1998 1999 2000 2001 2002 2003 2004 2005 2006 2007 Source: Halperin, et al (2009). Figure 16
Latin America Number of people living with HIV 2008 2.0 million [1.8 million–2.2 million] 2001 1.6 million [1.5 million–1.8 million] Number of new infections 2008 170 000 [150 000–200 000] 2001 150 000 [140 000–170 000] Number of children newly infected 2008 6900 [4200–9700] 2001 6200 [3800–9100] Number of AIDS-related deaths 2008 77 000 [66 000–89 000] 2001 66 000 [56 000–77 000]
Latin America estimates 1990–2008 Number of people living with HIV Adult (15–49) HIV prevalence (%) 2.5 1.0 2.0 0.8 Number(millions) 1.5 0.6 % 1.0 0.4 0.5 0.2 0 0 1990 1993 1996 1999 2002 2005 2008 1990 1993 1996 1999 2002 2005 2008 Number of people newly infected with HIV Number of adult and child deaths due to AIDS 250 250 200 200 Number(thousands) Number(thousands) 150 150 100 100 50 50 0 0 1990 1993 1996 1999 2002 2005 2008 1990 1993 1996 1999 2002 2005 2008 Estimate High and low estimates Source: UNAIDS/WHO Figure 17
Distribution of HIV incidence by mode of exposure in Peru: estimate for 2010 Men who have sex with men 54.97% Low-risk heterosexual Partners of clients of female sex workers 6.36% Casual heterosexual sex 6.30% Female partners of men who have sex with men 6.22% Partners (casual heterosexual sex) 5.54% Injecting drug users Risk groups 1.98% Clients of female sex workers 1.33% Female sex workers 0.89% Medical injections 0.23% Partners (injecting drug users) 0.22% Blood transfusions 0.0% Without risk 0.0% 0 10 20 30 40 50 60 % Source: Alarcón Villaverde (2009). Figure 18
Estimated HIV-1 seroprevalence and 95% confidence interval for HIV among men who have sex with men and female sex workers by country 25 Men who have sex with men Female sex workers 20 15.3 15 12.4 12.1 HIV seroprevalence (%) 11.7 10 9.6 8.9 7.6 5 4.3 3.6 3.2 0.2 0.2 0 n: 281 484 157 511 267 493 145 460 235 418 1085 2366 El Salvador Guatemala Honduras Nicaragua Panama All countries Source: Soto et al. (2007). Figure 19
Condom use among female sex workers who attend VICITS (Vigilancia Centinela de ITS) in Tegucigalpa, San Pedro Sula and La Ceiba, Honduras, in 2008 96.7% 100 80 60 % 40.7% 40 20 10.6% 0 With clients With casual partners With regular partners Condom use (n= 463) Source: Secretaria de Salud Honduras (2008). Figure 20
North America and Western and Central Europe Number of people living with HIV 2008 2.3 million [1.9 million–2.6 million] 2001 1.9 million [1.7 million–2.1 million] Number of new infections 2008 75 000 [49 000–97 000] 2001 93 000 [76 000–110 000] Number of children newly infected 2008 <500 [<200–<500] 2001 <500 [<200–<500] Number of AIDS-related deaths 2008 38 000 [27 000–61 000] 2001 27 000 [18 000–42 000]
North America and Western and Central Europe estimates 1990–2008 Number of people living with HIV Adult (15–49) HIV prevalence (%) 3 0.6 Number(millions) 2 0.4 % 1 0.2 0 0 1990 1993 1996 1999 2002 2005 2008 1990 1993 1996 1999 2002 2005 2008 Estimate High and low estimates Source: UNAIDS/WHO Figure 21
Yearly number of new HIV and AIDS cases and related deaths in Switzerland, 1995–2008 1200 1000 800 Number of people 600 400 200 0 1995 1996 1997 1998 1999 2000 2001 2002 2003 2004 2005 2006 2007 2008 HIV Death with AIDS AIDS cases Death without AIDS Source: Federal Office of Public Health (2009). Figure 22
Estimated new HIV infections by transmission category, extended back calculation model, 50 US states and the District of Columbia, 1977–2006 80 000 70 000 60 000 MSM / IDU Heterosexual 50 000 Infections 40 000 30 000 20 000 10 000 0 1977- 1979 1980- 1981 1982- 1983 1984- 1985 1986- 1987 1988- 1990 1991- 1993 1994- 1996 1997- 1999 2000- 2002 2003- 2006 Period Men who have sex with men (MSM) Injecting drug use (IDU) Tick marks denote the beginning and end of a year. The model specified periods within which the number of HIV infections was assumed to be approximately constant. Source: Hall et al. (2008a). Figure 23
Middle East and North Africa Number of people living with HIV 2008 310 000 [250 000–380 000] 2001 200 000 [150 000–250 000] Number of new infections 2008 35 000 24 000–46 000 2001 30 000 [23 000–40 000] Number of children newly infected 2008 4600 [2300–7500] 2001 3800 [1900–6400] Number of AIDS-related deaths 2008 20 000 [15 000–25 000] 2001 11 000 [7800–14 000]
Middle East and North Africa estimates 1990–2008 Number of people living with HIV Adult (15–49) HIV prevalence (%) 400 0.4 300 0.3 Number(thousands) % 200 0.2 100 0.1 0 0 1990 1993 1996 1999 2002 2005 2008 1990 1993 1996 1999 2002 2005 2008 Number of people newly infected with HIV Number of adult and child deaths due to AIDS 50 50 40 40 Number(thousands) Number(thousands) 30 30 20 20 10 10 0 0 1990 1993 1996 1999 2002 2005 2008 1990 1993 1996 1999 2002 2005 2008 Estimate High and low estimates Source: UNAIDS/WHO Figure 24
Percentage of condom use as reported by street children, male injecting drug users, female sex workers and men who have sex with men in Egypt 15 13.0% 12.0% 11.8% 9.2% 10 % 6.8% 5 0 Street boys Street girls Male injecting drug users Female sex workers Men who have sex with men At least once in 12 months prior to survey Last practice Source: Shawky et al. (2009). Figure 25
Oceania Number of people living with HIV 2008 59 000 [51 000–68 000] 2001 36 000 [29 000–45 000] Number of new infections 2008 3900 2900–5100 2001 5900 [4800–7300] Number of children newly infected 2008 <500 [<500–<1000] 2001 <500 [<200–<500] Number of AIDS-related deaths 2008 2000 [1100–3100] 2001 <1000 [<5000–1200]
Oceania estimates 1990–2008 Number of people living with HIV Adult (15–49) HIV prevalence (%) 80 0.4 Number(thousands) 60 0.3 % 40 0.2 20 0.1 0 0 1990 1993 1996 1999 2002 2005 2008 1990 1993 1996 1999 2002 2005 2008 Number of people newly infected with HIV Number of adult and child deaths due to AIDS 8 8 6 6 Number(thousands) Number(thousands) 4 4 2 2 0 0 1990 1993 1996 1999 2002 2005 2008 1990 1993 1996 1999 2002 2005 2008 Estimate High and low estimates Source: UNAIDS/WHO Figure 26
Proportion of all HIV and AIDS cases in different Pacific island countries and territories, 1984–2007 New Caledonia 1.2% French Polynesia 1.1% Fiji 1.1% Guam 0.8% All others 0.8% Papua New Guinea 95.0% Sources: The Secretariat of the Pacific Community and the Papua New Guinea Department of Health. Figure 27
Annual newly diagnosed HIV infections in Australia, 1999–2008 1200 1000 800 Number of people 600 400 200 0 1999 2000 2001 2002 2003 2004 2005 2006 2007 2008 Source: National Centre in HIV Epidemiology and Clinical Research (2009). Figure 28
HIV infections detected in Papua New Guinea, by age, 1987–2006 3000 2500 Male Female Sex not Stated 2000 Number 1500 1000 500 0 0-4 5-9 10-14 15-19 20-24 25-29 30-34 35-39 40-44 45-49 50-54 55-59 Over 60 Unknown Age group Source: Papua New Guinea National AIDS Council and Department of Health. Figure 29