Download
1 / 11
110 likes | 263 Views
Spreadsheets. Spreadsheets. Software program capable of performing many calculations, functions, graphs Arranged in rows (by number) and columns (letters) Intersection of a row and column is the cell reference , e.g., B4. Basic Calculations. Sum a row or column of numbers

E N D
Spreadsheets • Software program capable of performing many calculations, functions, graphs • Arranged in rows (by number) and columns (letters) • Intersection of a row and column is the cell reference, e.g., B4
Basic Calculations • Sum a row or column of numbers • Method 1: use the Auto sum • Method 2: key using formula bar: • Notice the “range” inside the brackets
More Calculations • =E9-E8 Subtract the value in E8 from E9 • =G3*F2 Multiplies G3 by F2 • =K3/C4 Divides K3 by C4 • =AVERAGE(E1:E8) Finds the average value in this range • =MIN(E1:E8) Finds the lowest value in this range • =MAX(E1:E8) Finds the largest value in this range • =COUNT(E1:E8) Reports the quantity of entries in this range
Growth Formulas • Useful to show increase in value • Example 1: =B4+B4*0.05 (fair) • Example 2: =B4*1.05 (better) • Example 3: =B4*$K$1 (best) • Where $K$1 contains % you can change!
Fill Feature • Create a formula and “drag” lower right corner to apply across or down (click the pic!)
IF Formula • =IF(B9>-1,"Profit","Loss") • Show the word "profit" if the value is zero or higher, otherwise shows the word "Loss"
Absolute Cell Referencing • By default copied or filled formulas reflect related cells • What if we need % of one total? • $ signs in cells signify the cell is constant
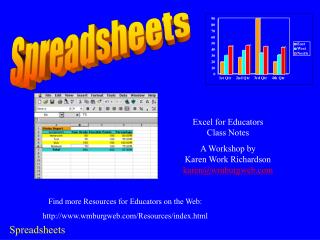
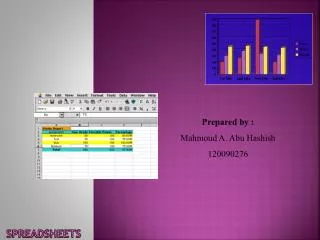
Graphing • By default column A is the x-axis and B, C, D, etc. are for values (Y-axes) • Use the graph icon • Name the series to create proper legends • Excel graphs are drab … spice them up!
Graphing • 3D Column Graph • Better!