Download
1 / 61
610 likes | 627 Views
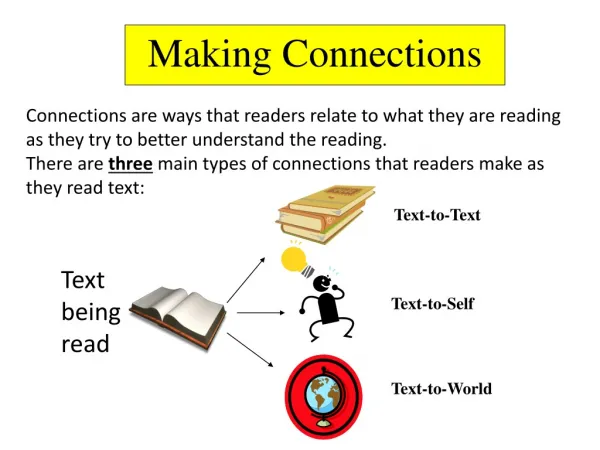
Making Connections. Connecting TEAM to your Data September 2012. Purposes of the Session. Online Resources (guest.portaportal.com/firsttnvalueadded) Connecting TEAM and the Data Where is the data (TEAM, Pearson, TVAAS)? Understanding Where the Numbers Come From

E N D
Making Connections Connecting TEAM to your Data September 2012
Purposes of the Session • Online Resources (guest.portaportal.com/firsttnvalueadded) • Connecting TEAM and the Data • Where is the data (TEAM, Pearson, TVAAS)? • Understanding Where the Numbers Come From • Using the Pearson & TVAAS Sites to Drive Individual Goals and Gains • TVAAS and TEAM
“Think Aloud” • Where would you go to find out how many students were proficient and advanced? • Where would you find out how your boys did on the tests as opposed to your girls? • Where would you get information about whether your high achieving students were doing well under your instruction? • Where would you find out how effective you are in helping students grow? • Where would you go to find out which Reporting Category was your weakest?
Three Important Sites All require usernames and passwords… • EdTools • This is your website for your TEAM Evaluation Composite. • PearsonAccess • This is your website for obtaining various “static” TCAP and EOC reports from the previous year…and home to the all-important ‘number correct.’ • TVAAS Restricted • This is your website for finding your Teacher Effect Report and your students’ projections.
PearsonAccess Once logging in, you will click on “Test Results”
Published Reports Next click on “Published Reports”
Choose Your School Choose your school…feeders apply!
Select the Report The Class Report is your access to the “number correct”. This is crucial information in identifying “bubble students”.
Importance of Cut Scores Useful in setting student goals.
Make Observations Look for +/- 5 for proficient and advanced. Student Names appear in this column.
“Think Aloud” What are we doing at our school to identify and move “bubble students”?
TVAAS Restricted Site • All-important place to find: • School value-added data • Teacher Effect (Composite Reports) • Student Projections • School Composite Reports (for TEAM) • Trend Data • Downloadable as Excel documents • School Comparison Searches • Find schools similar to yours • Performance Matrix
TVAAS Restricted Site 2.0 • There’s much more here than there used to be! • Use the site and encourage other teachers to use the site. • Projection Explanations…there is a reason teachers need to look at student projections; it is like a “commercial preview” of each and every student.
TVAAS Restricted Site 2.0 • Quick Points • Custom Student Reports • Class Projections • Downloadable data (Export feature) • Student Trajectory Charts • Perfect for data notebooks & conversations! • Remember how to interpret and use the grade scale. • It does not take many more questions correct to move value-added forward! Crucial to student conversations!
What do I want to know about what I see? • Who are these students? • Is this an issue grade-wide or contained in certain classrooms? • Did these students make less than a year’s growth in 2010? • What interventions were used with these students? 67/ 87students are in the top two quintiles. Prior two years show better gain scores Four quintiles show a range of below a year’s growth from -3 to -7
So, what next? • You have cut scores from the previous year… • You have projections to the current year… • You have a new instructional framework in TEAM…
“Think Aloud” What are some ways in which you can use this information and make it a part of your instructional approach?
Data has to drive everything… but keep your focus on the whole child…
“What counts isn’t always counted, and what is counted doesn’t always count…”
“From Numbers to Names: A Reminder” We have to be willing to take time to have discussions about individual students. It works and it matters…and a lot can happen in a year!
Data Checkpoints… • Are you having student conversations around goals? • Are you giving students multiple opportunities to understand their own progress? • Review and discussion of resources on the Portal. guest.portaportal.com/firsttnvalueadded
Conversations… • Who is talking? • Who are they talking to? • What are they talking about? • When are they talking?
“Think Aloud” What could this look like at your school?
Effective communication about the Common Core standards, importance, and potential Expanded use of frequent data conversations Formative and Benchmark Assessment Student achievement Principal-led conversations (power of TEAM & post-conferences) about instruction Focused Use of Curriculum • Alignment of accountability structure for our transition to the Common Core
TVAAS and TEAM TEAM gives us a new opportunity to have conversations about student scores and gain…
Academic Feedback Grouping Students Teacher Content Knowledge Teacher Knowledge of Students Thinking Problem Solving Indicators Standards and Objectives Motivating Students Presenting Instructional Content Lesson Structure and Pacing Activities and Materials Questioning
“Think Aloud” What four indicators were your weakest in your observations last year? How can using the Pearson data and the TVAAS data help you improve these indicators in your observations this year?
1. Directs attention to the intended learning, pointing out strengths and offering specific information to guide improvement • “Success” feedback • “The strongest part of your solution is….” • “The table you drew really helped solve the problem.” • “Intervention” feedback • Identify a correction • Offer a reminder • Make a suggestion • Ask a question • Occurs during learning, while there is still time to act on it • Delivered while there is still time to act • Students need to ask, “What does this tell me I know?” and “What do I still need to work on?” Characteristics of Academic Feedback
Addresses partial understanding • Works best when it addresses “faulty” understanding • Does not do the thinking for the student • Feedback by questioning • “Your strategy worked for part of the problem, but it didn’t lead to a correct solution.” • Limits corrective information to the amount of advice the student can act on • Make sure students know what to do with corrective information • If the feedback is daunting, students will shut down
Evaluative Feedback Descriptive Feedback • Typically uses a single measurement • May compare students to each other • Does not give students information about specific elements (knowledge, skills) they perform well • May encourage competition • Sometimes linked to rewards vs. punishments • Generally summative type of assessment • Describes features of work or performance • Relates directly to learning targets and/or standards of quality using exemplars, rubrics and/or samples • Points out strengths and gives specific information on how to improve • Provides strategies for moving forward • Promotes learning by increasing motivation • Formative assessment
Questioning Bloom’s Taxonomy Webb’s Depth of Knowledge • Recall • Skill/Concept • Strategic Thinking • Extended Thinking • Remembering • Understanding • Applying • Analyzing • Evaluating • Creating