Download
1 / 26
280 likes | 436 Views
Seasonality and a Trend. Dr. Ron Lembke. Washoe Gaming Win, 1993-96. What did they mean when they said it was down three quarters in a row?. Look at year-over-year. 1993 1994 1995 1996. Seasonality. Seasonality is regular up or down movements in the data

E N D
Seasonality and a Trend Dr. Ron Lembke
Washoe Gaming Win, 1993-96 What did they mean when they said it was down three quarters in a row? Look at year-over-year 1993 1994 1995 1996
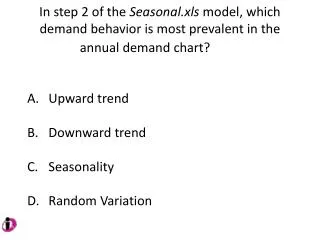
Seasonality • Seasonality is regular up or down movements in the data • Can be hourly, daily, weekly, yearly • Naïve method • N1: Assume January sales will be same as December • N2: Assume this Friday’s ticket sales will be same as last
Seasonal Factors • Seasonal factor for May is 1.20, means May sales are typically 20% above the average • Factor for July is 0.90, meaning July sales are typically 10% below the average
Seasonality & No Trend Sales Factor Spring 200 200/250 = 0.8 Summer 350 350/250 = 1.4 Fall 300 300/250 = 1.2 Winter 150 150/250 = 0.6 Total 1,000 4.0 Avg 1,000/4=250
Seasonal Factors • Compute average for each period • Compute overall average • Divide period averages by overall to get indexes. • Ok to have different # of data points
Seasonality & No Trend If we expected total demand for the next year to be 1,100, the average per quarter would be 1,100/4=275 Forecast Spring 275 * 0.8 = 220 Summer 275 * 1.4 = 385 Fall 275 * 1.2 = 330 Winter 275 * 0.6 = 165 Total 1,100
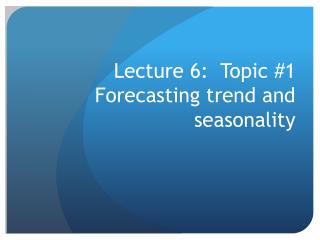
Trend & Seasonality • Deseasonalize to find the trend • Calculate seasonal factors • Deseasonalize the demand • Find trend of deseasonalized line • Project trend into the future • Project trend line into future • Multiply trend line by seasonal component.
Seasonally Adjusting • Makes it easier to see trends BLS data, 2012 BLS report, 2012
Washoe Gaming Win, 1993-96 • Looks like a downhill slide • Silver Legacy opened 95Q3 • Otherwise, upward trend 1993 1994 1995 1996 Source: Comstock Bank, Survey of Nevada Business & Economics
Washoe Win 1989-1996 Definitely a general upward trend, slowed 93-94
1989-2007 Red line shows “de-seasonalized” data
1998-2007 Cache Creek Thunder Valley CC Expands 9/11
Selecting Data • What data to use? • All of it? Representative? • Overall upward trend • 2000-2003, downwards • From 2003, fairly stable? • From 2003 upward trend? • The data you select to use has significant impact on the results you get and the conclusions you draw. • Spend time making sure data are representative
2003-2012 LR using 2008Q3-2010Q4 R-squared = 0.78
2011 Forecast using 2003-10 SR Data for LR Seasonal Indexes calculated using 2003-10 data
How Good Was It? Pattern fits data pretty well, but win better than expected.
2.Deseasonalize Deseasonalize by dividing actual number by index Use same index value for All Q1s, same number for All Q2s, etc.
3.LR on Deseasonalized data 2008 Q4-2012Q1 Intercept = 210,576,193 Slope = -2,065,456 R-squared = 0.75
4.Project trend line into future Intercept = 210,576,193 Slope = -2,065,456
Summary • Calculate indexes • Deseasonalize • Divide actual demands by seasonal indexes • Do a LR • Project the LR into the future • Seasonalize • Multiply straight-line forecast by indexes