Download
1 / 9
90 likes | 244 Views
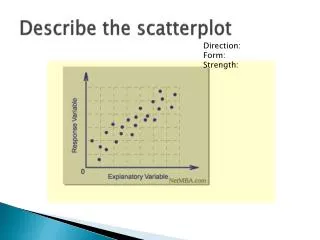
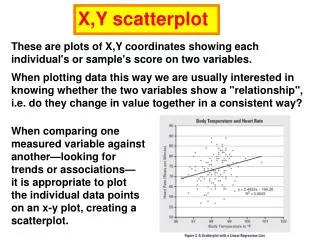
Summarizing a scatterplot trend. A scatterplot is messy. It can be hard to interpret. One way to summarize the trend in a scatterplot is to draw a straight line through the plot. Let’s take a look at a simple data set. Summarizing a scatterplot trend.

E N D
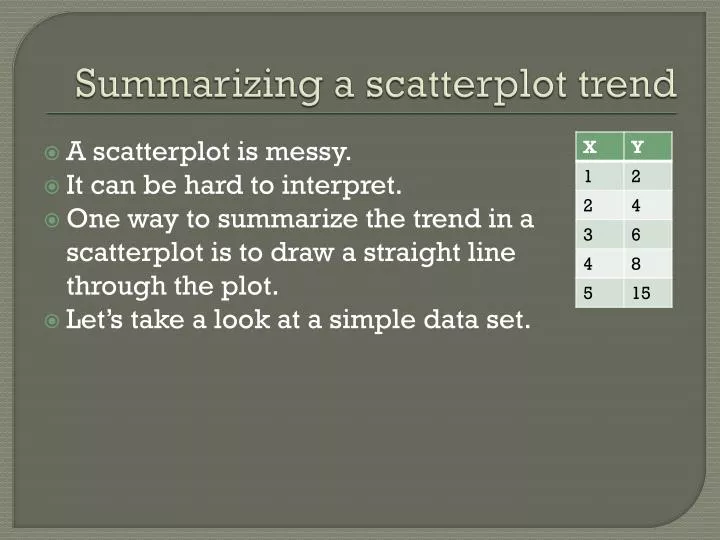
Summarizing a scatterplot trend • A scatterplot is messy. • It can be hard to interpret. • One way to summarize the trend in a scatterplot is to draw a straight line through the plot. • Let’s take a look at a simple data set.
Summarizing a scatterplot trend • Graph this data set on your calculator. • How should we draw a line through this set of points? • What is the BEST line to fit this data set? • Try something!
Summarizing a scatterplot trend • There are many ways to do this… • Statisticians tend to rely on a line-fitting method called Least Squares Regression.
Background There is a lot of theoretical math behind the derivation of this linear function. We will leave that for a later math course. For now, it is enough to know that the slope and y-intercept of the LSRL minimizes this quantity:
Some notation first The mean x coordinate: The mean y coordinate: The standard deviation of the x’s: The standard deviation of the y’s: An important fact – the point is ALWAYS on the LSRL.
Now the y-intercept is… And the slope is…
How do you decide when a linear model is appropriate? We look at the residual plots. That will involve making a scatterplotafter we have run linreg(ax + b) When a linear model is appropriate, the residual plot will NOT show any pattern.
Residual plots This is a residual plot with a definite pattern. This is what you are looking for. So is this. Linear models are NOT appropriate here