Download
1 / 16
160 likes | 253 Views
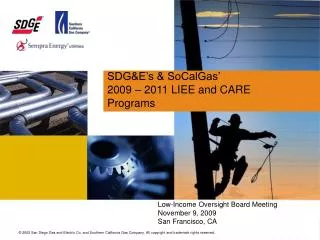
Energy Savings SDG&E and SoCalGas. ESAP Workshop 2 October 19, 2011. San diego gas & electric. Annual Energy Savings and Costs by Measure Categories Proposed Average Year for PY2012 to 2014 Actual Average Year for PY2009 to 2011. SDG&E PY2012 to PY2014 Avg Year.

E N D
Energy SavingsSDG&E and SoCalGas ESAP Workshop 2 October 19, 2011
Annual Energy Savings and Costs by Measure Categories Proposed Average Year for PY2012 to 2014 Actual Average Year for PY2009 to 2011
SDG&E PY2012 to PY2014 Avg Year Homes treated: SF: 10,236 MF: 8,243 MH: 1,521 Total: 20,000 Souce: Table A-2, A-4 from PY2012 to 2014 Application, Average Year
SDG&E PY2009 to PY2011 Avg Year Homes treated: SF: 10,139 MF: 10,380 MH: 1,074 Total: 21,593 Souce: Table A-2, A-8 from PY2010 Annual Reprt
Annual Energy Savings, Units Installed and Costs by Measure Proposed Average Year for PY2012 to 2014 (used 2012) Actual Average Year for PY2009 to 2011 (used 2010)
Annual Energy Savings and Costs by Measure Categories Proposed Average Year for PY2012 to 2014 Actual Average Year for PY2009 to 2011
SoCalGas PY2012 to PY2014 Avg Yr Homes treated: SF: 71,146 MF: 22,374 MH: 6,730 Total: 100,249 Souce: Table A-2, A-4 from PY2012 to 2014 Application, Average Year
SoCalGas PY2009 to PY2011 Avg Yr Homes treated: SF: 86,067 MF: 27,066 MH: 8,141 Total: 121,274 Souce: Table A-2, A-8 from PY2010 Annual Report
Annual Energy Savings, Units Installed and Costs by Measure Proposed Average Year for PY2012 to 2014 (used 2012) Actual Average Year for PY2009 to 2011 (used 2010)