Download
1 / 11
110 likes | 187 Views
MIS 2000 Bob Travica. Class 5 More on Data Analysis Updated Jan. 2014. Outline Analyzing data in different business situations Differentiating entities and attributes Analyzing associations between entities Exercise. Supplier SupplierID SName SAddress. Purchasing Operations .

E N D
MIS 2000 Bob Travica Class 5 More on Data Analysis Updated Jan. 2014
Outline • Analyzing data in different business situations • Differentiating entities and attributes • Analyzing associations between entities • Exercise
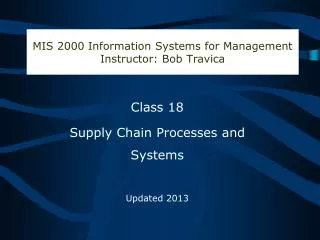
Supplier SupplierID SName SAddress Purchasing Operations PODetail Quantity Discount Product ProductID PName ListPrice Specifications Purchase Order PONum PODate Business starts on the supply side. Companies purchase raw materials and half-products in order to produce a more complete or a final product. So, the product is a key business object, which becomes an entity in a data diagram. Product is ordered from a supplier via a purchasing order (PO). PO is a concept and it translates into a business document (electronic, paper). In case of services, the supply side is not tangible (e.g., lenders supplying financial resources in banking). ^ placed with M includes M Data diagram for purchasing process
Production Operations Worker WorkerID Wname Department Position Specialty Schedule Date Shift Overtime Task TaskID TName Description Time A company's supplies are transformed in production operations, whether in manufacturing or operations. Production includes several processes, one being scheduling. Schedule is the key entity. A scheduling process needs to track minimally the tasks to be performed and workers, and it needs to produce a calendar-like output showing who is doing what and when (schedule). planned in assigned to Data diagram for production scheduling process
Human Resources (HR ) WorkHours Date HoursRegular HoursOvertime Pay PayRecordNo PayPeriod TotalPaid Employee EmployeeID Ename Department Position Specialty DateHired Salary SalaryID AmountYear Overtime Wage WageID RateRegular RateOvertime Amount(calculate) HR is a broad area covering recruiting, training, pay, wellness, grievances, etc. The key entity is employee. For the pay process, the important entity is pay. Generally, the pay is either salary (fixed hours) or wage (variable number of hours). gets is determine earns Data diagram for the pay process in human resources management
Accounting OperatingCost OpAccountID Account Receivable ARAccountID ARName Organization… Account Payable APAccountID APName Organization… Budget BAccountID Sale SAccountID Interest IAccountID Purchase PuAccountID Pay PaAccountID Accounting tracks monetary value of all tangible things on the inflow (revenue) and outflow (cost) side. These two objects translate into revenue and cost entities or accounts (there can be many of each). Account is the key entity. There are many types of account—receivables (revenues) vs. payables (costs); revenues and costs each has specific kinds of accounts based on sources, etc. is is Data diagram (partial) for expense accounts Data diagram (partial) for income accounts More
Ledger LedgerEntryID Date Time Amount(in/out) AcitivityReference# Accounting Account Payable APccountID APName Organization Date Balance Account Receivable ARAccountID ARName Organization Date Balance • The revenue and cost entities are connected via a central entity Ledger (storage of all entries which updates individual accounts). < updates updates Data diagram for a generic accounting process and information system
Customer CustomerID CType Cname CLocation Product ProductID PName Market Segment MSegmentID SpendLevel Description Marketing Customer Product MonthYear Total Marketing processes create and manage markets. Customer is the key entity. To understand markets, market profiling (segmentation) is performed, resulting in entity MarketSegment. The main data are customer totals – aggregation of sales figures. Market segment should be identified by grouping customers on purchase totals into SpendLevel groups (e.g., high, mid, low). Customer totals per product refine market segments. buys belongs to Data diagram for marker segmenting
Sales Grocery Store The data diagram is similar to the one used in the class on data analysis & diagramming. Key entity is Sale. New details: - Sale as an event (instead of Order) - RewardCard Customer CustomerID CType Cname CLocation Sale SaleRecordNo Date Cashier made to RewardCard RewardCardNo DateIssued Points SaleDetail Quantity has includes Product ProductID PName ListPrice
Library Do not get scared! This is how a more fully developed data diagram looks like. Focus on key entities and their relationships. To be added: - keys - association names
CatalogSearch SearchNumber Date Terms Searched E-commerce Customer CustomerIDCustomerType Name Address Email Online Store PageVisit PageID Date Web Pages Visited Screen Items Clicked performs Comparable Customer MatchedCustomerID does resembles Data diagram for online customer profiling (marketing) Online customer is invisible and its behavior happens in “cyber space.” New entities help to learn about invisible customer.